

5 Neutron Spectrum
131
5.1.3.2 Experimental Settings
In reaction rate experiments, an In foil (10 × 10 × 1 mm) was attached at the
boundary between (15, L) and (15, M) shown in Figs. A2.16a, d, in order to obtain
the information on spallation neutrons with the use of
115 In(n, n
)
115m In reactions
(threshold energy 0.3 MeV). Six foils, including gold (
197 Au; bare and cadmium:
Cd covered), iron (
56 Fe), aluminum (
27 Al),
115 In and nickel (
58 Ni), were used as
activation foils (Table A2.22) to cover a wide range of threshold energy and acquire
neutron spectrum information in the region of the Pb–Bi-zoned core affected by
spallation neutrons. The foils were attached at the boundary between fuel assemblies
(15, M) and (15, O) (Figs. A2.16a–d) with the dimensions and variations as shown in
Fig. A2.19. Among the six foils, the
197 Au foil (Au-bare) was taken as a normalization
factor of reactor power for
56 Fe,
27 Al,
115 In and
58 Ni foils. Furthermore, the Cd ratio
was experimentally obtained by the combination of two Au foils: Au-bare and AuCd sandwiched between two Cd plates (10 mm diameter and 1 mm thick), as a
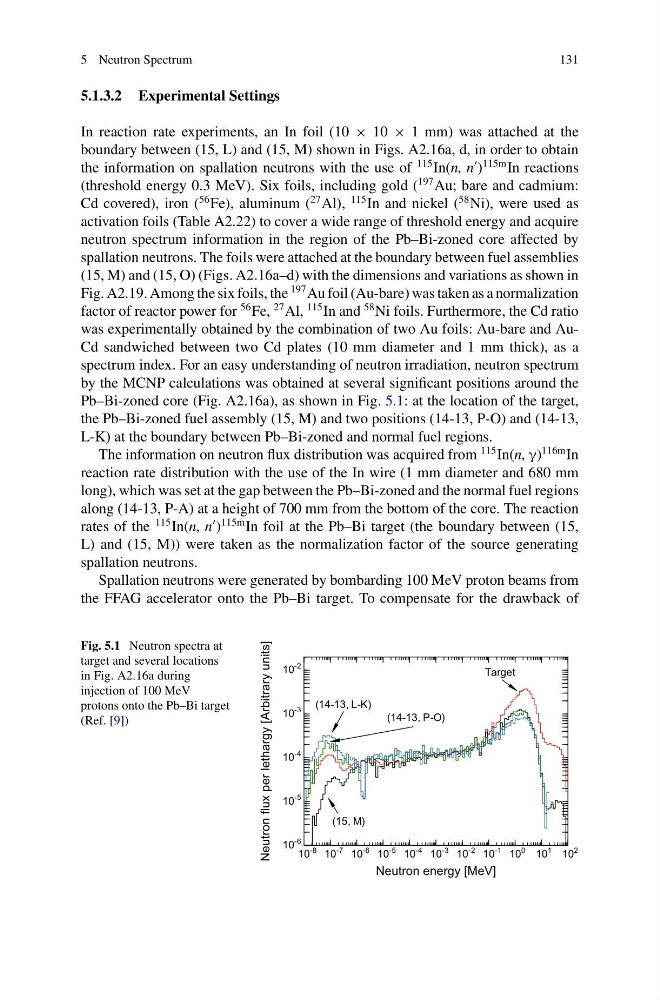
spectrum index. For an easy understanding of neutron irradiation, neutron spectrum
by the MCNP calculations was obtained at several significant positions around the
Pb–Bi-zoned core (Fig. A2.16a), as shown in Fig. 5.1: at the location of the target,
the Pb–Bi-zoned fuel assembly (15, M) and two positions (14-13, P-O) and (14-13,
L-K) at the boundary between Pb–Bi-zoned and normal fuel regions.
The information on neutron flux distribution was acquired from
115 In(n, γ)
116m In
reaction rate distribution with the use of the In wire (1 mm diameter and 680 mm
long), which was set at the gap between the Pb–Bi-zoned and the normal fuel regions
along (14-13, P-A) at a height of 700 mm from the bottom of the core. The reaction
rates of the
115 In(n, n
)
115m In foil at the Pb–Bi target (the boundary between (15,
L) and (15, M)) were taken as the normalization factor of the source generating
spallation neutrons.
Spallation neutrons were generated by bombarding 100 MeV proton beams from
the FFAG accelerator onto the Pb–Bi target. To compensate for the drawback of
Fig. 5.1 Neutron spectra at
target and several locations
in Fig. A2.16a during
injection of 100 MeV
protons onto the Pb–Bi target
(Ref. [9])
10
-8 10
-7 10
-6 10
-5 10
-4 10
-3 10
-2 10
-1 10
0 10
1 10
2
10
-6
10
-5
10
-4
10
-3
10
-2
Neutron energy [MeV]
Neutron flux per lethargy [Arbitrary units]
Target
(15, M)
(14-13, L-K)
(14-13, P-O)
131
5.1.3.2 Experimental Settings
In reaction rate experiments, an In foil (10 × 10 × 1 mm) was attached at the
boundary between (15, L) and (15, M) shown in Figs. A2.16a, d, in order to obtain
the information on spallation neutrons with the use of
115 In(n, n
)
115m In reactions
(threshold energy 0.3 MeV). Six foils, including gold (
197 Au; bare and cadmium:
Cd covered), iron (
56 Fe), aluminum (
27 Al),
115 In and nickel (
58 Ni), were used as
activation foils (Table A2.22) to cover a wide range of threshold energy and acquire
neutron spectrum information in the region of the Pb–Bi-zoned core affected by
spallation neutrons. The foils were attached at the boundary between fuel assemblies
(15, M) and (15, O) (Figs. A2.16a–d) with the dimensions and variations as shown in
Fig. A2.19. Among the six foils, the
197 Au foil (Au-bare) was taken as a normalization
factor of reactor power for
56 Fe,
27 Al,
115 In and
58 Ni foils. Furthermore, the Cd ratio
was experimentally obtained by the combination of two Au foils: Au-bare and AuCd sandwiched between two Cd plates (10 mm diameter and 1 mm thick), as a
spectrum index. For an easy understanding of neutron irradiation, neutron spectrum
by the MCNP calculations was obtained at several significant positions around the
Pb–Bi-zoned core (Fig. A2.16a), as shown in Fig. 5.1: at the location of the target,
the Pb–Bi-zoned fuel assembly (15, M) and two positions (14-13, P-O) and (14-13,
L-K) at the boundary between Pb–Bi-zoned and normal fuel regions.
The information on neutron flux distribution was acquired from
115 In(n, γ)
116m In
reaction rate distribution with the use of the In wire (1 mm diameter and 680 mm
long), which was set at the gap between the Pb–Bi-zoned and the normal fuel regions
along (14-13, P-A) at a height of 700 mm from the bottom of the core. The reaction
rates of the
115 In(n, n
)
115m In foil at the Pb–Bi target (the boundary between (15,
L) and (15, M)) were taken as the normalization factor of the source generating
spallation neutrons.
Spallation neutrons were generated by bombarding 100 MeV proton beams from
the FFAG accelerator onto the Pb–Bi target. To compensate for the drawback of
Fig. 5.1 Neutron spectra at
target and several locations
in Fig. A2.16a during
injection of 100 MeV
protons onto the Pb–Bi target
(Ref. [9])
10
-8 10
-7 10
-6 10
-5 10
-4 10
-3 10
-2 10
-1 10
0 10
1 10
2
10
-6
10
-5
10
-4
10
-3
10
-2
Neutron energy [MeV]
Neutron flux per lethargy [Arbitrary units]
Target
(15, M)
(14-13, L-K)
(14-13, P-O)