

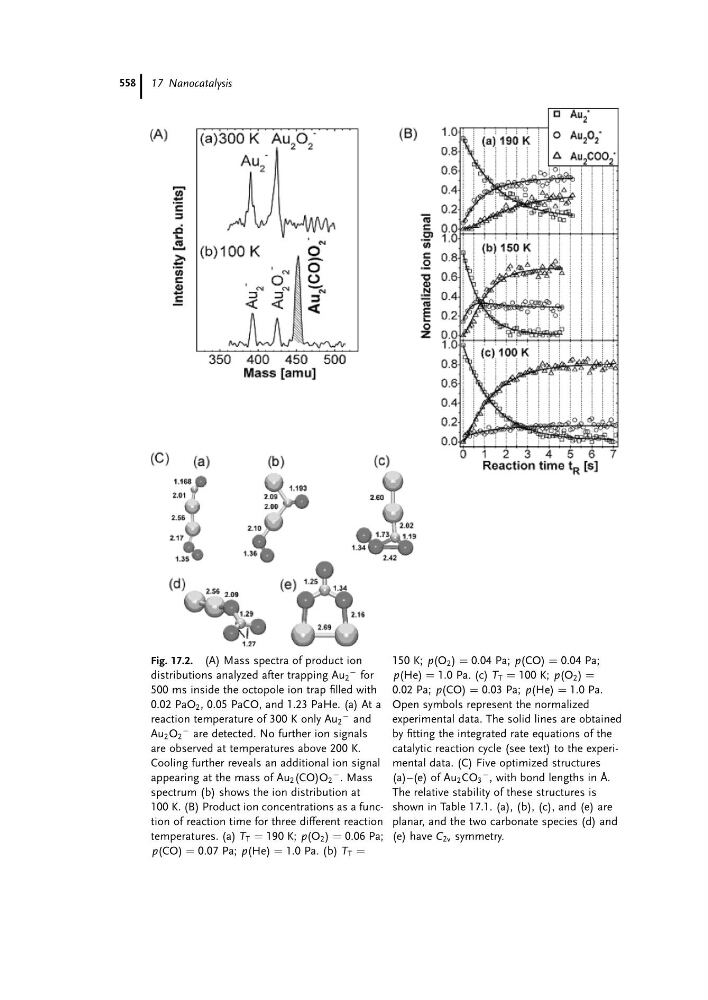
Fig. 17.2. (A) Mass spectra of product ion
distributions analyzed after trapping Au 2
À for
500 ms inside the octopole ion trap filled with
0.02 PaO 2 , 0.05 PaCO, and 1.23 PaHe. (a) At a
reaction temperature of 300 K only Au 2
À and
Au 2 O 2
À are detected. No further ion signals
are observed at temperatures above 200 K.
Cooling further reveals an additional ion signal
appearing at the mass of Au 2 (CO)O 2
À . Mass
spectrum (b) shows the ion distribution at
100 K. (B) Product ion concentrations as a function of reaction time for three different reaction
temperatures. (a) T T ¼ 190 K; p(O 2 ) ¼ 0.06 Pa;
p(CO) ¼ 0.07 Pa; p(He) ¼ 1.0 Pa. (b) T T ¼
150 K; p(O 2 ) ¼ 0.04 Pa; p(CO) ¼ 0.04 Pa;
p(He) ¼ 1.0 Pa. (c) T T ¼ 100 K; p(O 2 ) ¼
0.02 Pa; p(CO) ¼ 0.03 Pa; p(He) ¼ 1.0 Pa.
Open symbols represent the normalized
experimental data. The solid lines are obtained
by fitting the integrated rate equations of the
catalytic reaction cycle (see text) to the experimental data. (C) Five optimized structures
(a)–(e) of Au 2 CO 3
À , with bond lengths in A ˚ .
The relative stability of these structures is
shown in Table 17.1. (a), (b), (c), and (e) are
planar, and the two carbonate species (d) and
(e) have C 2v symmetry.
17 Nanocatalysis
558