

mize specimen charging. When used in conjunction with ancillary techniques
such as energy dispersive X-ray (EDX) analysis and electron energy loss spectroscopy (EELS), chemical microanalysis of minute regions of the porous substrate can
be completed. Atomic force microscopy (AFM) and scanning tunneling microscopy
(STM) can be used to physically image porous silicon surfaces to atomic-scale lateral resolution [15]; however, the dimensions of the scanning probe tip often exceed those of the porous matrix, resulting in distortion of the vertical scale. Using
gas adsorption, an approximation of the specific surface area of porous silicon can
be achieved through Brunauer–Emmett–Teller (BET) analysis [16]; values ranging
from less than 10
0 m
2 g
À1 for macroporous silicon to nearly 10
3 m
2 g
À1 for microporous substrates have been estimated. These expansive values for surface area
confirm the vast extent of porosity that is indigenous to this material; moreover,
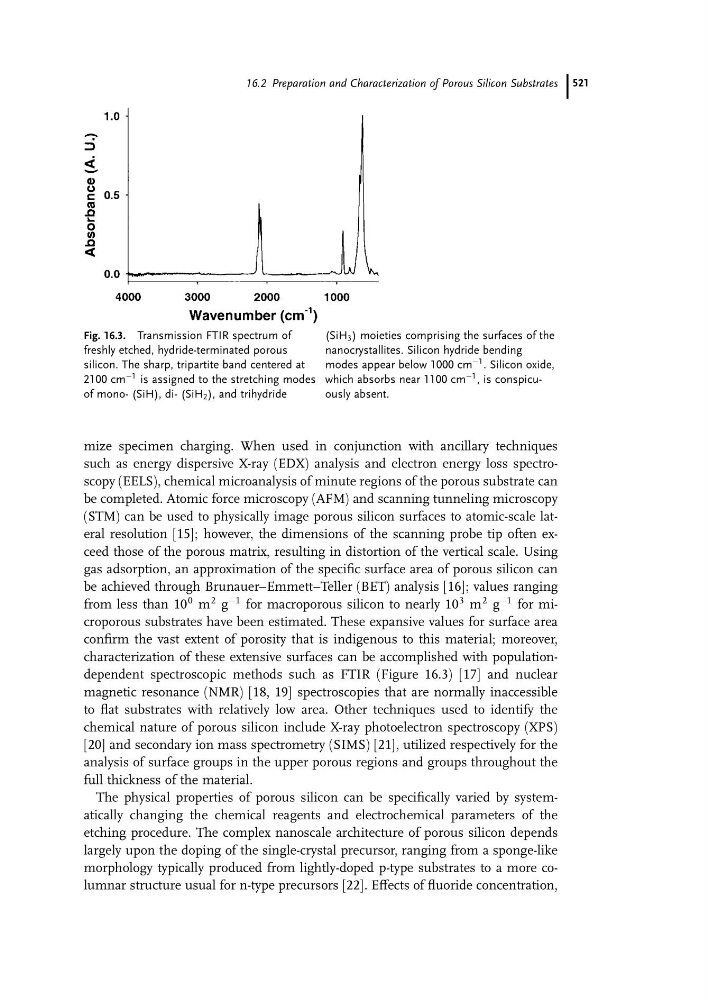
characterization of these extensive surfaces can be accomplished with populationdependent spectroscopic methods such as FTIR (Figure 16.3) [17] and nuclear
magnetic resonance (NMR) [18, 19] spectroscopies that are normally inaccessible
to flat substrates with relatively low area. Other techniques used to identify the
chemical nature of porous silicon include X-ray photoelectron spectroscopy (XPS)
[20] and secondary ion mass spectrometry (SIMS) [21], utilized respectively for the
analysis of surface groups in the upper porous regions and groups throughout the
full thickness of the material.
The physical properties of porous silicon can be specifically varied by systematically changing the chemical reagents and electrochemical parameters of the
etching procedure. The complex nanoscale architecture of porous silicon depends
largely upon the doping of the single-crystal precursor, ranging from a sponge-like
morphology typically produced from lightly-doped p-type substrates to a more columnar structure usual for n-type precursors [22]. Effects of fluoride concentration,
Fig. 16.3. Transmission FTIR spectrum of
freshly etched, hydride-terminated porous
silicon. The sharp, tripartite band centered at
2100 cm
À1 is assigned to the stretching modes
of mono- (SiH), di- (SiH 2 ), and trihydride
(SiH 3 ) moieties comprising the surfaces of the
nanocrystallites. Silicon hydride bending
modes appear below 1000 cm
À1 . Silicon oxide,
which absorbs near 1100 cm
À1 , is conspicuously absent.
16.2 Preparation and Characterization of Porous Silicon Substrates 521