

blue emission is short lived, of the order of nanoseconds. They did not observe the
orange emission in this case. However, for time delays as large as 0.5 ms, the only
observed emission was that of the Mn d–d transition. There was no blue component in the fluorescence spectrum recorded 0.5 ms after the excitation source was
switched off. This indicates that the Mn d–d transition is not a shortlived emission
but the timescales for this emission in the bulk and nanocrystalline Mn-doped ZnS
are about the same. Further studies on Mn-doped ZnS nanocrystalline samples
have established the absence of any Mn-related emission with a decay time in the
regime of nanoseconds [24, 25, 34].
It has been found that the emission due to Mn doping can be further tuned by
changing the crystal field around the Mn
2þ ions. Instead of the S
2À ions, as in the
case of ZnS, an oxide host can be used to induce a much larger crystal field splitting of the t 2g –e g levels in Mn
2þ ions, for example by doping Mn
2þ ions in ZnO
nanocrystals [20]. In this case, the Mn d–d emission is observed at @470 nm
(2.6 eV), representing a blue shift of 0.5 eV compared to the case of Mn emission
in Mn-doped ZnS.
4.0
3.5
3.0
2.5
2.0
ZnS
2% Mn-ZnS
5.5% Mn-ZnS
9% Mn-ZnS
13% Mn-ZnS
Fluorescence emission
Energy (eV)
Intensity (a.u.)
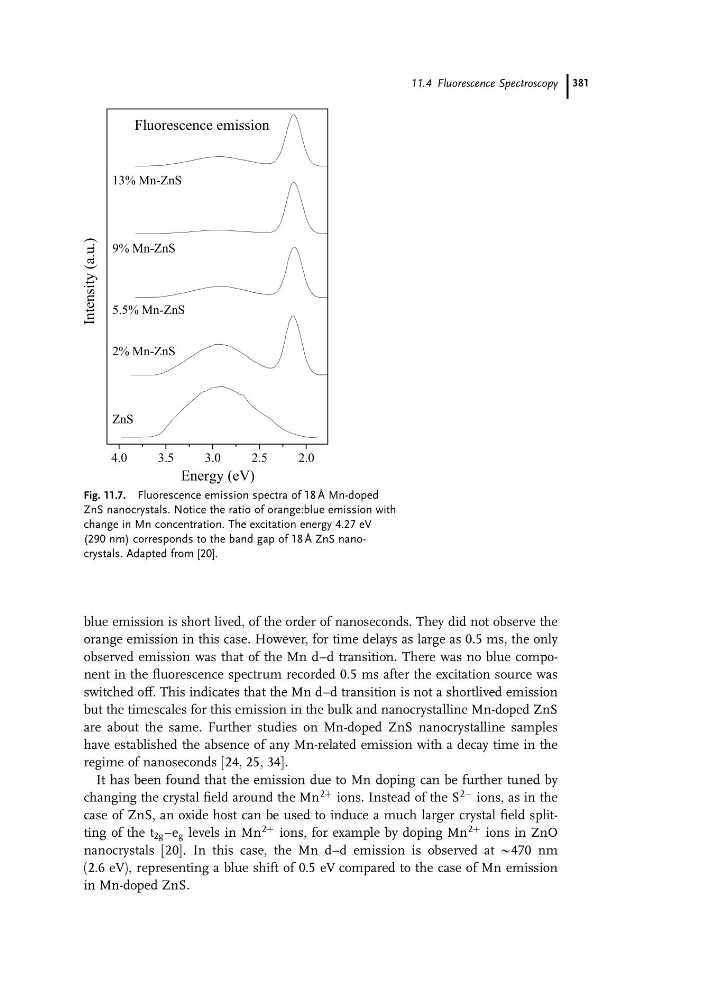
Fig. 11.7. Fluorescence emission spectra of 18 A ˚ Mn-doped
ZnS nanocrystals. Notice the ratio of orange:blue emission with
change in Mn concentration. The excitation energy 4.27 eV
(290 nm) corresponds to the band gap of 18 A ˚ ZnS nanocrystals. Adapted from [20].
11.4 Fluorescence Spectroscopy 381
orange emission in this case. However, for time delays as large as 0.5 ms, the only
observed emission was that of the Mn d–d transition. There was no blue component in the fluorescence spectrum recorded 0.5 ms after the excitation source was
switched off. This indicates that the Mn d–d transition is not a shortlived emission
but the timescales for this emission in the bulk and nanocrystalline Mn-doped ZnS
are about the same. Further studies on Mn-doped ZnS nanocrystalline samples
have established the absence of any Mn-related emission with a decay time in the
regime of nanoseconds [24, 25, 34].
It has been found that the emission due to Mn doping can be further tuned by
changing the crystal field around the Mn
2þ ions. Instead of the S
2À ions, as in the
case of ZnS, an oxide host can be used to induce a much larger crystal field splitting of the t 2g –e g levels in Mn
2þ ions, for example by doping Mn
2þ ions in ZnO
nanocrystals [20]. In this case, the Mn d–d emission is observed at @470 nm
(2.6 eV), representing a blue shift of 0.5 eV compared to the case of Mn emission
in Mn-doped ZnS.
4.0
3.5
3.0
2.5
2.0
ZnS
2% Mn-ZnS
5.5% Mn-ZnS
9% Mn-ZnS
13% Mn-ZnS
Fluorescence emission
Energy (eV)
Intensity (a.u.)
Fig. 11.7. Fluorescence emission spectra of 18 A ˚ Mn-doped
ZnS nanocrystals. Notice the ratio of orange:blue emission with
change in Mn concentration. The excitation energy 4.27 eV
(290 nm) corresponds to the band gap of 18 A ˚ ZnS nanocrystals. Adapted from [20].
11.4 Fluorescence Spectroscopy 381