

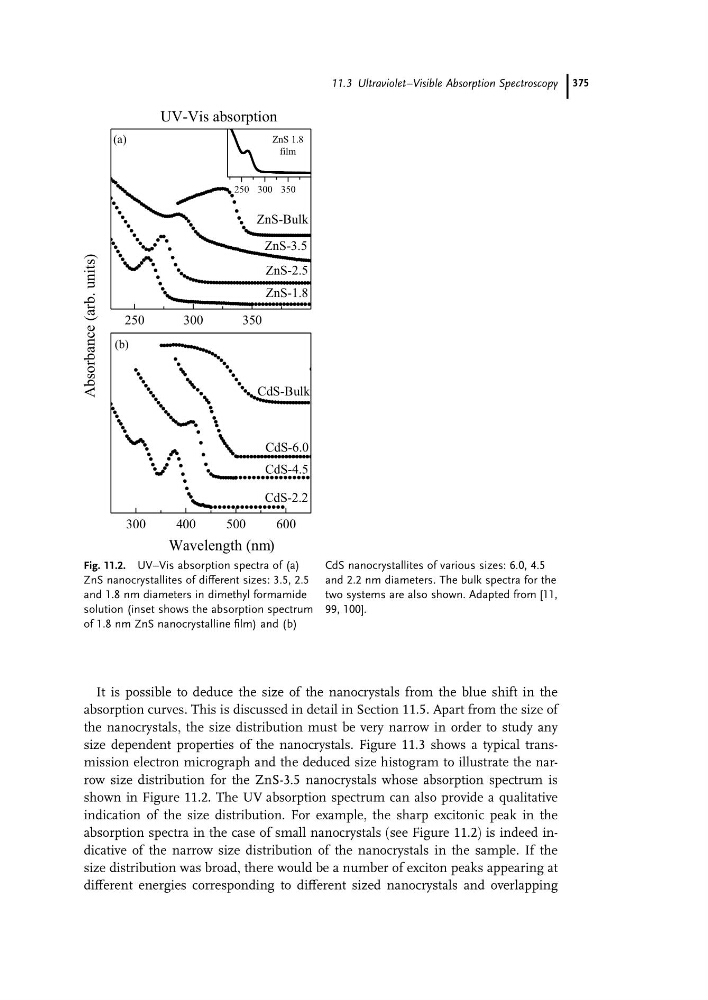
It is possible to deduce the size of the nanocrystals from the blue shift in the
absorption curves. This is discussed in detail in Section 11.5. Apart from the size of
the nanocrystals, the size distribution must be very narrow in order to study any
size dependent properties of the nanocrystals. Figure 11.3 shows a typical transmission electron micrograph and the deduced size histogram to illustrate the narrow size distribution for the ZnS-3.5 nanocrystals whose absorption spectrum is
shown in Figure 11.2. The UV absorption spectrum can also provide a qualitative
indication of the size distribution. For example, the sharp excitonic peak in the
absorption spectra in the case of small nanocrystals (see Figure 11.2) is indeed indicative of the narrow size distribution of the nanocrystals in the sample. If the
size distribution was broad, there would be a number of exciton peaks appearing at
different energies corresponding to different sized nanocrystals and overlapping
300
400
500
600
250
300
350
250 300 350
(b)
UV-Vis absorption
CdS-6.0
CdS-2.2
CdS-4.5
CdS-Bulk
Absorbance (arb. units)
Wavelength (nm)
(a)
ZnS-Bulk
ZnS-3.5
ZnS-2.5
ZnS-1.8
ZnS 1.8
film
Fig. 11.2. UV–Vis absorption spectra of (a)
ZnS nanocrystallites of different sizes: 3.5, 2.5
and 1.8 nm diameters in dimethyl formamide
solution (inset shows the absorption spectrum
of 1.8 nm ZnS nanocrystalline film) and (b)
CdS nanocrystallites of various sizes: 6.0, 4.5
and 2.2 nm diameters. The bulk spectra for the
two systems are also shown. Adapted from [11,
99, 100].
11.3 Ultraviolet–Visible Absorption Spectroscopy 375
absorption curves. This is discussed in detail in Section 11.5. Apart from the size of
the nanocrystals, the size distribution must be very narrow in order to study any
size dependent properties of the nanocrystals. Figure 11.3 shows a typical transmission electron micrograph and the deduced size histogram to illustrate the narrow size distribution for the ZnS-3.5 nanocrystals whose absorption spectrum is
shown in Figure 11.2. The UV absorption spectrum can also provide a qualitative
indication of the size distribution. For example, the sharp excitonic peak in the
absorption spectra in the case of small nanocrystals (see Figure 11.2) is indeed indicative of the narrow size distribution of the nanocrystals in the sample. If the
size distribution was broad, there would be a number of exciton peaks appearing at
different energies corresponding to different sized nanocrystals and overlapping
300
400
500
600
250
300
350
250 300 350
(b)
UV-Vis absorption
CdS-6.0
CdS-2.2
CdS-4.5
CdS-Bulk
Absorbance (arb. units)
Wavelength (nm)
(a)
ZnS-Bulk
ZnS-3.5
ZnS-2.5
ZnS-1.8
ZnS 1.8
film
Fig. 11.2. UV–Vis absorption spectra of (a)
ZnS nanocrystallites of different sizes: 3.5, 2.5
and 1.8 nm diameters in dimethyl formamide
solution (inset shows the absorption spectrum
of 1.8 nm ZnS nanocrystalline film) and (b)
CdS nanocrystallites of various sizes: 6.0, 4.5
and 2.2 nm diameters. The bulk spectra for the
two systems are also shown. Adapted from [11,
99, 100].
11.3 Ultraviolet–Visible Absorption Spectroscopy 375