

Thus, the apparent transformation of the spheroids to spheres in the presence of
cyanide, in air, may be depicted by the following cartoon:
In this cartoon, the width of the nanoparticles does not change, only its length.
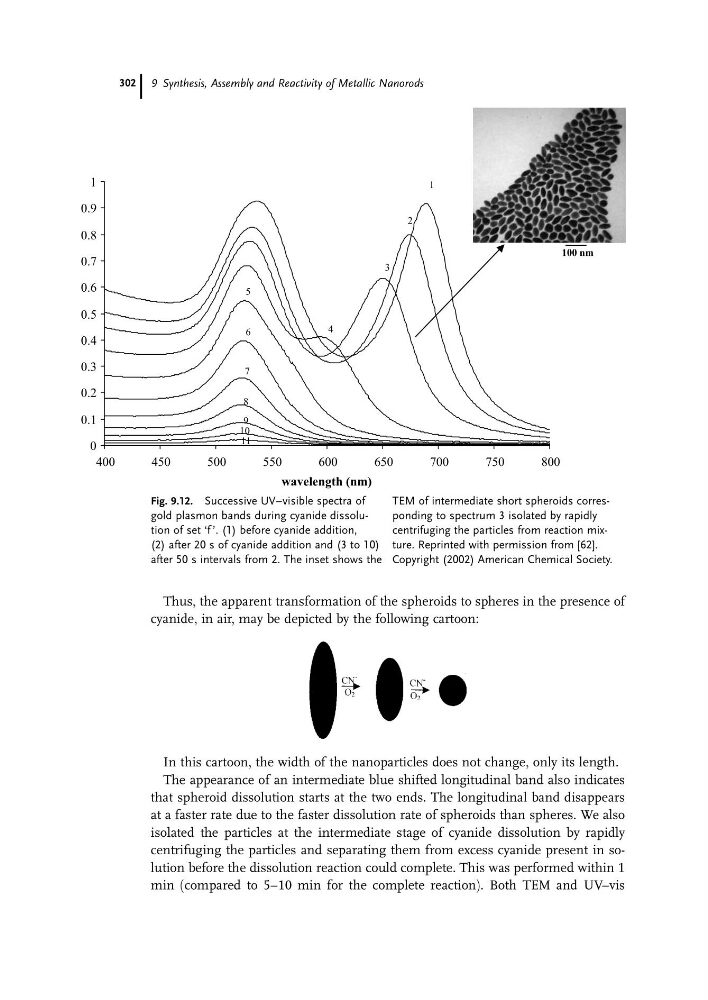
The appearance of an intermediate blue shifted longitudinal band also indicates
that spheroid dissolution starts at the two ends. The longitudinal band disappears
at a faster rate due to the faster dissolution rate of spheroids than spheres. We also
isolated the particles at the intermediate stage of cyanide dissolution by rapidly
centrifuging the particles and separating them from excess cyanide present in solution before the dissolution reaction could complete. This was performed within 1
min (compared to 5–10 min for the complete reaction). Both TEM and UV–vis
0
0.1
0.2
0.3
0.4
0.5
0.6
0.7
0.8
0.9
1
400
450
500
550
600
650
700
750
800
wavelength (nm)
1
2
3
4
5
6
7
8
9
10
11
100 nm
Fig. 9.12. Successive UV–visible spectra of
gold plasmon bands during cyanide dissolution of set ‘f ’. (1) before cyanide addition,
(2) after 20 s of cyanide addition and (3 to 10)
after 50 s intervals from 2. The inset shows the
TEM of intermediate short spheroids corresponding to spectrum 3 isolated by rapidly
centrifuging the particles from reaction mixture. Reprinted with permission from [62].
Copyright (2002) American Chemical Society.
9 Synthesis, Assembly and Reactivity of Metallic Nanorods
302
cyanide, in air, may be depicted by the following cartoon:
In this cartoon, the width of the nanoparticles does not change, only its length.
The appearance of an intermediate blue shifted longitudinal band also indicates
that spheroid dissolution starts at the two ends. The longitudinal band disappears
at a faster rate due to the faster dissolution rate of spheroids than spheres. We also
isolated the particles at the intermediate stage of cyanide dissolution by rapidly
centrifuging the particles and separating them from excess cyanide present in solution before the dissolution reaction could complete. This was performed within 1
min (compared to 5–10 min for the complete reaction). Both TEM and UV–vis
0
0.1
0.2
0.3
0.4
0.5
0.6
0.7
0.8
0.9
1
400
450
500
550
600
650
700
750
800
wavelength (nm)
1
2
3
4
5
6
7
8
9
10
11
100 nm
Fig. 9.12. Successive UV–visible spectra of
gold plasmon bands during cyanide dissolution of set ‘f ’. (1) before cyanide addition,
(2) after 20 s of cyanide addition and (3 to 10)
after 50 s intervals from 2. The inset shows the
TEM of intermediate short spheroids corresponding to spectrum 3 isolated by rapidly
centrifuging the particles from reaction mixture. Reprinted with permission from [62].
Copyright (2002) American Chemical Society.
9 Synthesis, Assembly and Reactivity of Metallic Nanorods
302