

substrate solution, 30 mg tablets may also be used in place of
6 Â 5 mg tablets).
6. Remove plastic wrap and wash the plates 5Â with 200 μL per
well of Wash Buffer solution using the automated plate washer.
7. Add 100 μL of OPD substrate solution to each well (see Note
13).
8. Put the plates in a dark drawer at room temperature for 30 min.
9. After the 30-min incubation, add 50 μL of Stop Solution to
each well in the same order the substrate was added.
10. Read the plate at an optical density of 450 to 490 nm
(OD 450 to OD490) using a microplate reader (see Note 14).
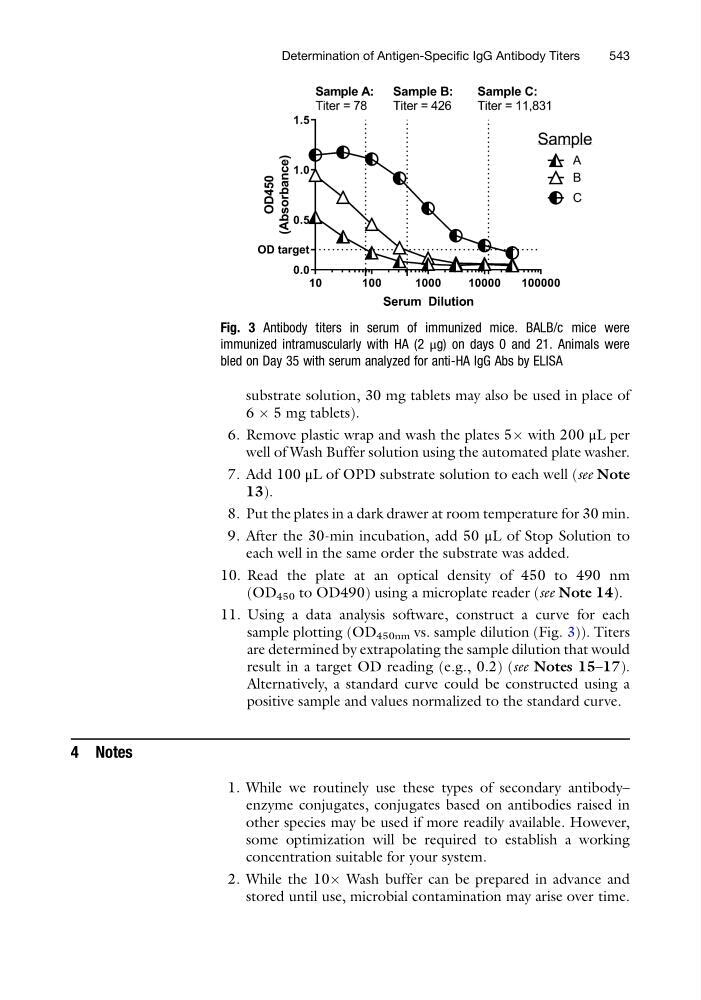
11. Using a data analysis software, construct a curve for each
sample plotting (OD 450nm vs. sample dilution (Fig. 3)). Titers
are determined by extrapolating the sample dilution that would
result in a target OD reading (e.g., 0.2) (see Notes 15–17).
Alternatively, a standard curve could be constructed using a
positive sample and values normalized to the standard curve.
4 Notes
1. While we routinely use these types of secondary antibody–
enzyme conjugates, conjugates based on antibodies raised in
other species may be used if more readily available. However,
some optimization will be required to establish a working
concentration suitable for your system.
2. While the 10Â Wash buffer can be prepared in advance and
stored until use, microbial contamination may arise over time.
Fig. 3 Antibody titers in serum of immunized mice. BALB/c mice were
immunized intramuscularly with HA (2 μg) on days 0 and 21. Animals were
bled on Day 35 with serum analyzed for anti-HA IgG Abs by ELISA
Determination of Antigen-Specific IgG Antibody Titers
543
6 Â 5 mg tablets).
6. Remove plastic wrap and wash the plates 5Â with 200 μL per
well of Wash Buffer solution using the automated plate washer.
7. Add 100 μL of OPD substrate solution to each well (see Note
13).
8. Put the plates in a dark drawer at room temperature for 30 min.
9. After the 30-min incubation, add 50 μL of Stop Solution to
each well in the same order the substrate was added.
10. Read the plate at an optical density of 450 to 490 nm
(OD 450 to OD490) using a microplate reader (see Note 14).
11. Using a data analysis software, construct a curve for each
sample plotting (OD 450nm vs. sample dilution (Fig. 3)). Titers
are determined by extrapolating the sample dilution that would
result in a target OD reading (e.g., 0.2) (see Notes 15–17).
Alternatively, a standard curve could be constructed using a
positive sample and values normalized to the standard curve.
4 Notes
1. While we routinely use these types of secondary antibody–
enzyme conjugates, conjugates based on antibodies raised in
other species may be used if more readily available. However,
some optimization will be required to establish a working
concentration suitable for your system.
2. While the 10Â Wash buffer can be prepared in advance and
stored until use, microbial contamination may arise over time.
Fig. 3 Antibody titers in serum of immunized mice. BALB/c mice were
immunized intramuscularly with HA (2 μg) on days 0 and 21. Animals were
bled on Day 35 with serum analyzed for anti-HA IgG Abs by ELISA
Determination of Antigen-Specific IgG Antibody Titers
543