

the concentration of sodium chloride (NaCl) and increasing
the pH (i.e., Table 3, Column 7 and 8 for MMC conditions).
2. In the buffer preparation script, the gradients are prepared in a
step-wise fashion and the salt concentration changes in a stepwise fashion. However, the pH change will not show such a
simple trend; instead it will follow a nonlinear trend common
for titration curves. Once prepared, determine the pH of all
prepared solution buffers experimentally using an off-line pH
probe (see Note 16).
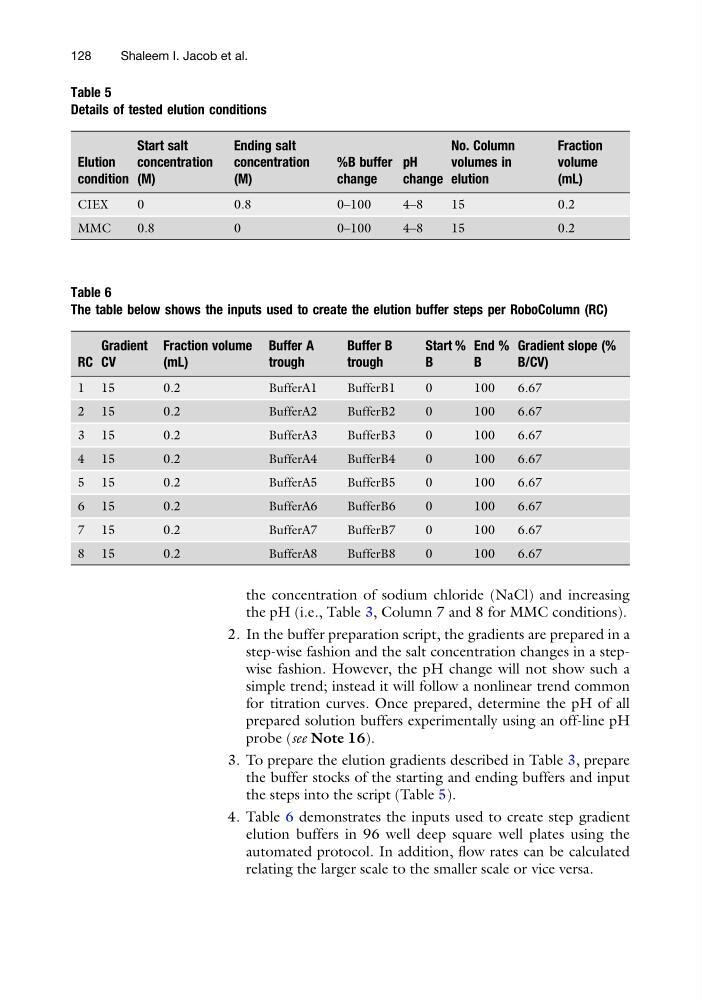
3. To prepare the elution gradients described in Table 3, prepare
the buffer stocks of the starting and ending buffers and input
the steps into the script (Table 5).
4. Table 6 demonstrates the inputs used to create step gradient
elution buffers in 96 well deep square well plates using the
automated protocol. In addition, flow rates can be calculated
relating the larger scale to the smaller scale or vice versa.
Table 5
Details of tested elution conditions
Elution
condition
Start salt
concentration
(M)
Ending salt
concentration
(M)
%B buffer
change
pH
change
No. Column
volumes in
elution
Fraction
volume
(mL)
CIEX
0
0.8
0–100
4–8
15
0.2
MMC
0.8
0
0–100
4–8
15
0.2
Table 6
The table below shows the inputs used to create the elution buffer steps per RoboColumn (RC)
RC
Gradient
CV
Fraction volume
(mL)
Buffer A
trough
Buffer B
trough
Start %
B
End %
B
Gradient slope (%
B/CV)
1 15
0.2
BufferA1
BufferB1
0
100
6.67
2 15
0.2
BufferA2
BufferB2
0
100
6.67
3 15
0.2
BufferA3
BufferB3
0
100
6.67
4 15
0.2
BufferA4
BufferB4
0
100
6.67
5 15
0.2
BufferA5
BufferB5
0
100
6.67
6 15
0.2
BufferA6
BufferB6
0
100
6.67
7 15
0.2
BufferA7
BufferB7
0
100
6.67
8 15
0.2
BufferA8
BufferB8
0
100
6.67
128
Shaleem I. Jacob et al.
the pH (i.e., Table 3, Column 7 and 8 for MMC conditions).
2. In the buffer preparation script, the gradients are prepared in a
step-wise fashion and the salt concentration changes in a stepwise fashion. However, the pH change will not show such a
simple trend; instead it will follow a nonlinear trend common
for titration curves. Once prepared, determine the pH of all
prepared solution buffers experimentally using an off-line pH
probe (see Note 16).
3. To prepare the elution gradients described in Table 3, prepare
the buffer stocks of the starting and ending buffers and input
the steps into the script (Table 5).
4. Table 6 demonstrates the inputs used to create step gradient
elution buffers in 96 well deep square well plates using the
automated protocol. In addition, flow rates can be calculated
relating the larger scale to the smaller scale or vice versa.
Table 5
Details of tested elution conditions
Elution
condition
Start salt
concentration
(M)
Ending salt
concentration
(M)
%B buffer
change
pH
change
No. Column
volumes in
elution
Fraction
volume
(mL)
CIEX
0
0.8
0–100
4–8
15
0.2
MMC
0.8
0
0–100
4–8
15
0.2
Table 6
The table below shows the inputs used to create the elution buffer steps per RoboColumn (RC)
RC
Gradient
CV
Fraction volume
(mL)
Buffer A
trough
Buffer B
trough
Start %
B
End %
B
Gradient slope (%
B/CV)
1 15
0.2
BufferA1
BufferB1
0
100
6.67
2 15
0.2
BufferA2
BufferB2
0
100
6.67
3 15
0.2
BufferA3
BufferB3
0
100
6.67
4 15
0.2
BufferA4
BufferB4
0
100
6.67
5 15
0.2
BufferA5
BufferB5
0
100
6.67
6 15
0.2
BufferA6
BufferB6
0
100
6.67
7 15
0.2
BufferA7
BufferB7
0
100
6.67
8 15
0.2
BufferA8
BufferB8
0
100
6.67
128
Shaleem I. Jacob et al.