

14.8 Optical Fiber Network Performance Testing
615
The second term in Eq. (14.20) is used to give an OSNR value that is independent
of the resolution bandwidth B m of the instrument. This allows a comparison of OSNR
results that may have been obtained with different OSA instruments. The IEC 612802-9 standard also notes that in order to achieve an adequate OSNR measurement,
the wavelength measurement range of the OSA must be wide enough to include all
DWDM channels plus one-half of an ITU-T grid spacing at each end of the spectral
range. In addition, the resolution bandwidth must be wide enough to include the
entire signal power spectrum of each modulated channel because this has a direct
impact on the accuracy of the noise measurement.
14.8.3 Q Factor Estimation
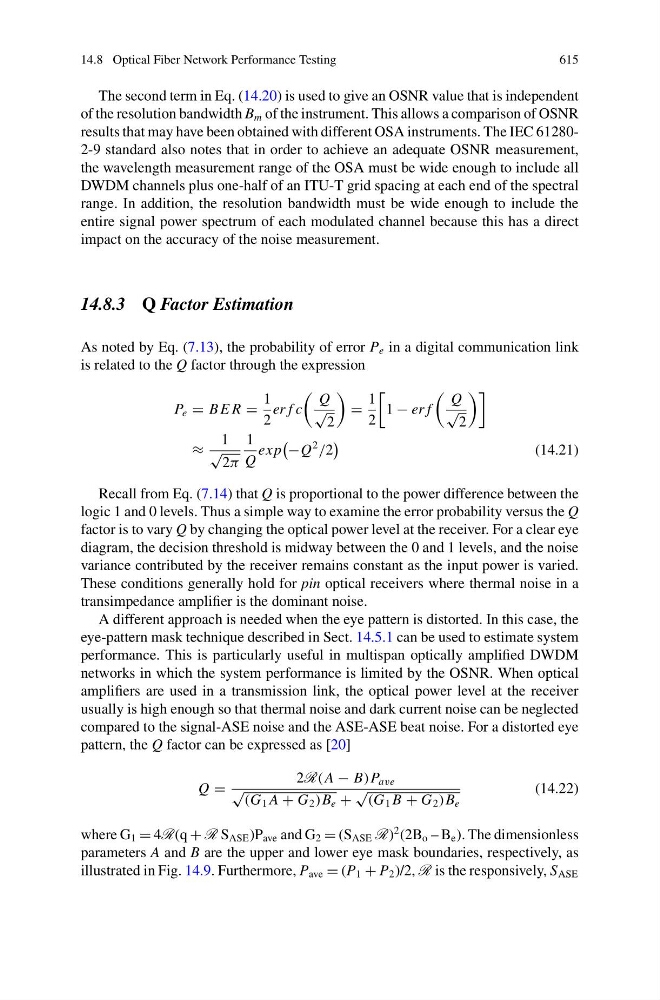
As noted by Eq. (7.13), the probability of error P e in a digital communication link
is related to the Q factor through the expression
P e = B E R =
1
2
er f c
Q
√
2
=
1
2
1 − er f
Q
√
2
≈
1
√
2π
1
Q
ex p
−Q
2
/2
(14.21)
Recall from Eq. (7.14) that Q is proportional to the power difference between the
logic 1 and 0 levels. Thus a simple way to examine the error probability versus the Q
factor is to vary Q by changing the optical power level at the receiver. For a clear eye
diagram, the decision threshold is midway between the 0 and 1 levels, and the noise
variance contributed by the receiver remains constant as the input power is varied.
These conditions generally hold for pin optical receivers where thermal noise in a
transimpedance amplifier is the dominant noise.
A different approach is needed when the eye pattern is distorted. In this case, the
eye-pattern mask technique described in Sect. 14.5.1 can be used to estimate system
performance. This is particularly useful in multispan optically amplified DWDM
networks in which the system performance is limited by the OSNR. When optical
amplifiers are used in a transmission link, the optical power level at the receiver
usually is high enough so that thermal noise and dark current noise can be neglected
compared to the signal-ASE noise and the ASE-ASE beat noise. For a distorted eye
pattern, the Q factor can be expressed as [20]
Q =
2R(A − B)P ave
√ (G 1 A + G 2 )B e +
√ (G 1 B + G 2 )B e
(14.22)
where G 1 = 4R(q + R S ASE )P ave and G 2 = (S ASE R)
2 (2B o – B e ). The dimensionless
parameters A and B are the upper and lower eye mask boundaries, respectively, as
illustrated in Fig. 14.9. Furthermore, P ave = (P 1 + P 2 )/2, R is the responsively, S ASE