

11.5 Optical Signal-To-Noise Ratio (OSNR)
459
In order to have a meaningful assessment of what the OSNR tells about system
performance, a connection is needed between OSNR and bit-error rate (BER). A
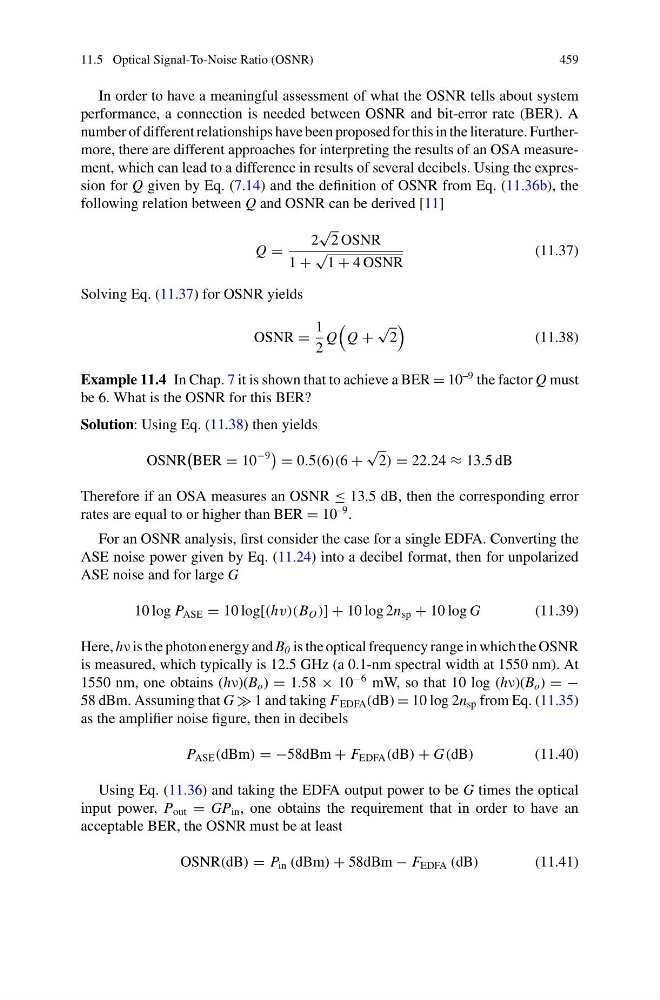
number of different relationships have been proposed for this in the literature. Furthermore, there are different approaches for interpreting the results of an OSA measurement, which can lead to a difference in results of several decibels. Using the expression for Q given by Eq. (7.14) and the definition of OSNR from Eq. (11.36b), the
following relation between Q and OSNR can be derived [11]
Q =
2
√
2 OSNR
1 +
√
1 + 4 OSNR
(11.37)
Solving Eq. (11.37) for OSNR yields
OSNR =
1
2
Q
Q +
√
2
(11.38)
Example 11.4 In Chap. 7 it is shown that to achieve a BER = 10
–9 the factor Q must
be 6. What is the OSNR for this BER?
Solution: Using Eq. (11.38) then yields
OSNR
BER = 10
−9
= 0.5(6)(6 +
√
2) = 22.24 ≈ 13.5 dB
Therefore if an OSA measures an OSNR ≤ 13.5 dB, then the corresponding error
rates are equal to or higher than BER = 10
–9 .
For an OSNR analysis, first consider the case for a single EDFA. Converting the
ASE noise power given by Eq. (11.24) into a decibel format, then for unpolarized
ASE noise and for large G
10 log P ASE = 10 log[(hv)(B O )] + 10 log 2n sp + 10 log G
(11.39)
Here, hν is the photon energy and B 0 is the optical frequency range in which the OSNR
is measured, which typically is 12.5 GHz (a 0.1-nm spectral width at 1550 nm). At
1550 nm, one obtains (hν)(B o ) = 1.58 × 10
−6 mW, so that 10 log (hν)(B o ) = −
58 dBm. Assuming that G 1 and taking F EDFA (dB) = 10 log 2n sp from Eq. (11.35)
as the amplifier noise figure, then in decibels
P ASE (dBm) = −58dBm + F EDFA (dB) + G(dB)
(11.40)
Using Eq. (11.36) and taking the EDFA output power to be G times the optical
input power, P out = GP in , one obtains the requirement that in order to have an
acceptable BER, the OSNR must be at least
OSNR(dB) = P in (dBm) + 58dBm − F EDFA (dB)
(11.41)
459
In order to have a meaningful assessment of what the OSNR tells about system
performance, a connection is needed between OSNR and bit-error rate (BER). A
number of different relationships have been proposed for this in the literature. Furthermore, there are different approaches for interpreting the results of an OSA measurement, which can lead to a difference in results of several decibels. Using the expression for Q given by Eq. (7.14) and the definition of OSNR from Eq. (11.36b), the
following relation between Q and OSNR can be derived [11]
Q =
2
√
2 OSNR
1 +
√
1 + 4 OSNR
(11.37)
Solving Eq. (11.37) for OSNR yields
OSNR =
1
2
Q
Q +
√
2
(11.38)
Example 11.4 In Chap. 7 it is shown that to achieve a BER = 10
–9 the factor Q must
be 6. What is the OSNR for this BER?
Solution: Using Eq. (11.38) then yields
OSNR
BER = 10
−9
= 0.5(6)(6 +
√
2) = 22.24 ≈ 13.5 dB
Therefore if an OSA measures an OSNR ≤ 13.5 dB, then the corresponding error
rates are equal to or higher than BER = 10
–9 .
For an OSNR analysis, first consider the case for a single EDFA. Converting the
ASE noise power given by Eq. (11.24) into a decibel format, then for unpolarized
ASE noise and for large G
10 log P ASE = 10 log[(hv)(B O )] + 10 log 2n sp + 10 log G
(11.39)
Here, hν is the photon energy and B 0 is the optical frequency range in which the OSNR
is measured, which typically is 12.5 GHz (a 0.1-nm spectral width at 1550 nm). At
1550 nm, one obtains (hν)(B o ) = 1.58 × 10
−6 mW, so that 10 log (hν)(B o ) = −
58 dBm. Assuming that G 1 and taking F EDFA (dB) = 10 log 2n sp from Eq. (11.35)
as the amplifier noise figure, then in decibels
P ASE (dBm) = −58dBm + F EDFA (dB) + G(dB)
(11.40)
Using Eq. (11.36) and taking the EDFA output power to be G times the optical
input power, P out = GP in , one obtains the requirement that in order to have an
acceptable BER, the OSNR must be at least
OSNR(dB) = P in (dBm) + 58dBm − F EDFA (dB)
(11.41)