

11.2 Semiconductor Optical Amplifiers
447
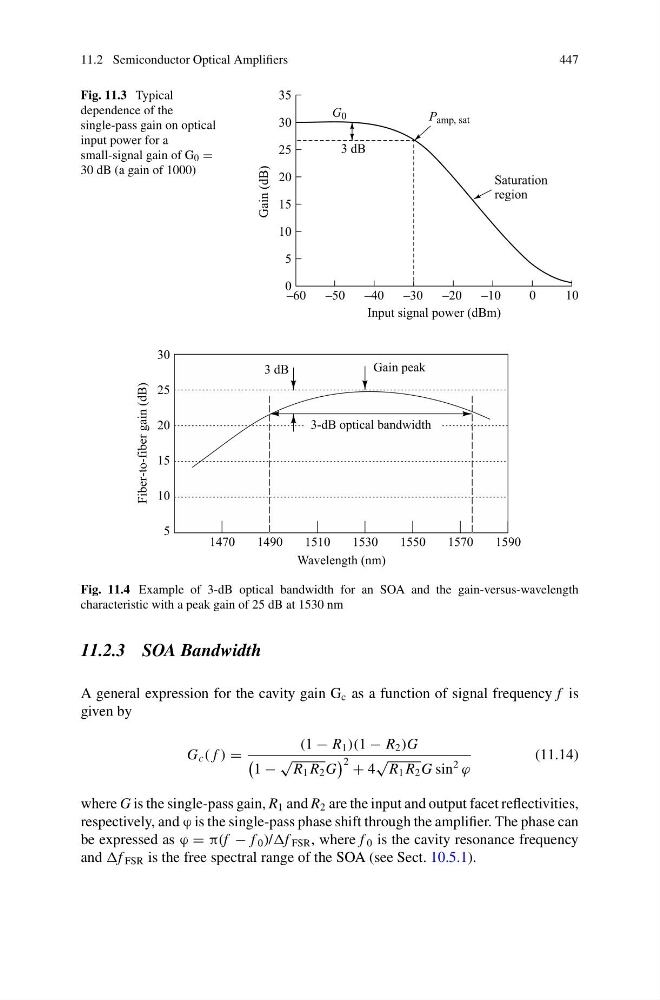
Fig. 11.3 Typical
dependence of the
single-pass gain on optical
input power for a
small-signal gain of G 0 =
30 dB (a gain of 1000)
Fig. 11.4 Example of 3-dB optical bandwidth for an SOA and the gain-versus-wavelength
characteristic with a peak gain of 25 dB at 1530 nm
11.2.3 SOA Bandwidth
A general expression for the cavity gain G c as a function of signal frequency f is
given by
G c ( f ) =
(1 − R 1 )(1 − R 2 )G
1 −
√
R 1 R 2 G
2 + 4
√
R 1 R 2 G sin
2
ϕ
(11.14)
where G is the single-pass gain, R 1 and R 2 are the input and output facet reflectivities,
respectively, and ϕ is the single-pass phase shift through the amplifier. The phase can
be expressed as ϕ = π(f − f 0 )/ FSR , where f 0 is the cavity resonance frequency
and FSR is the free spectral range of the SOA (see Sect. 10.5.1).
447
Fig. 11.3 Typical
dependence of the
single-pass gain on optical
input power for a
small-signal gain of G 0 =
30 dB (a gain of 1000)
Fig. 11.4 Example of 3-dB optical bandwidth for an SOA and the gain-versus-wavelength
characteristic with a peak gain of 25 dB at 1530 nm
11.2.3 SOA Bandwidth
A general expression for the cavity gain G c as a function of signal frequency f is
given by
G c ( f ) =
(1 − R 1 )(1 − R 2 )G
1 −
√
R 1 R 2 G
2 + 4
√
R 1 R 2 G sin
2
ϕ
(11.14)
where G is the single-pass gain, R 1 and R 2 are the input and output facet reflectivities,
respectively, and ϕ is the single-pass phase shift through the amplifier. The phase can
be expressed as ϕ = π(f − f 0 )/ FSR , where f 0 is the cavity resonance frequency
and FSR is the free spectral range of the SOA (see Sect. 10.5.1).