

3 Low-Carbon Transition (Peaking) of Chinese Cities: The Case …
87
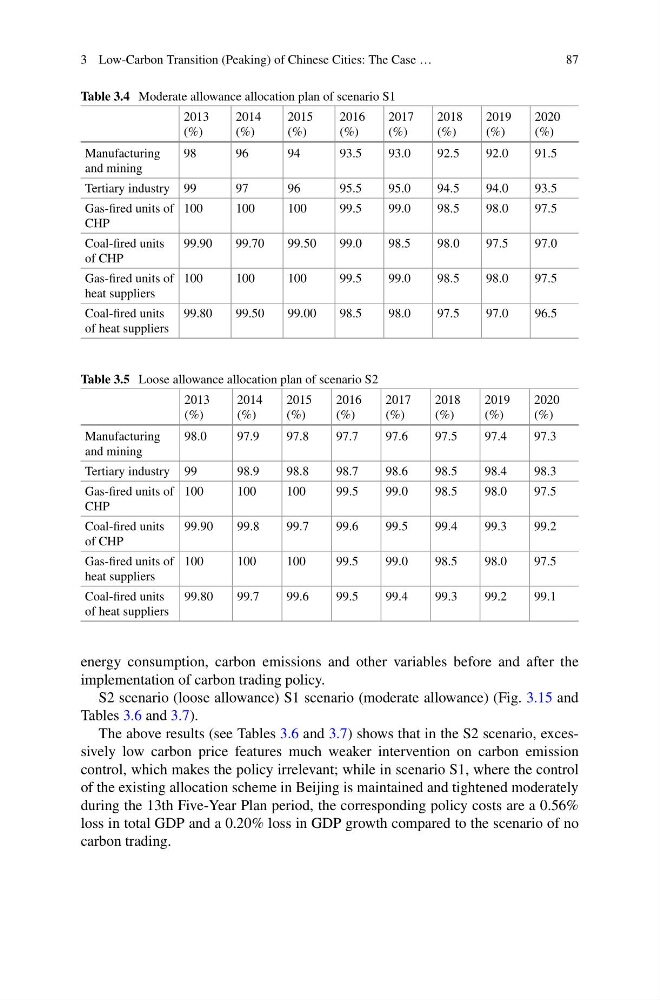
Table 3.4 Moderate allowance allocation plan of scenario S1
2013
(%)
2014
(%)
2015
(%)
2016
(%)
2017
(%)
2018
(%)
2019
(%)
2020
(%)
Manufacturing
and mining
98
96
94
93.5
93.0
92.5
92.0
91.5
Tertiary industry 99
97
96
95.5
95.0
94.5
94.0
93.5
Gas-fired units of
CHP
100
100
100
99.5
99.0
98.5
98.0
97.5
Coal-fired units
of CHP
99.90
99.70
99.50
99.0
98.5
98.0
97.5
97.0
Gas-fired units of
heat suppliers
100
100
100
99.5
99.0
98.5
98.0
97.5
Coal-fired units
of heat suppliers
99.80
99.50
99.00
98.5
98.0
97.5
97.0
96.5
Table 3.5 Loose allowance allocation plan of scenario S2
2013
(%)
2014
(%)
2015
(%)
2016
(%)
2017
(%)
2018
(%)
2019
(%)
2020
(%)
Manufacturing
and mining
98.0
97.9
97.8
97.7
97.6
97.5
97.4
97.3
Tertiary industry 99
98.9
98.8
98.7
98.6
98.5
98.4
98.3
Gas-fired units of
CHP
100
100
100
99.5
99.0
98.5
98.0
97.5
Coal-fired units
of CHP
99.90
99.8
99.7
99.6
99.5
99.4
99.3
99.2
Gas-fired units of
heat suppliers
100
100
100
99.5
99.0
98.5
98.0
97.5
Coal-fired units
of heat suppliers
99.80
99.7
99.6
99.5
99.4
99.3
99.2
99.1
energy consumption, carbon emissions and other variables before and after the
implementation of carbon trading policy.
S2 scenario (loose allowance) S1 scenario (moderate allowance) (Fig. 3.15 and
Tables 3.6 and 3.7).
The above results (see Tables 3.6 and 3.7) shows that in the S2 scenario, excessively low carbon price features much weaker intervention on carbon emission
control, which makes the policy irrelevant; while in scenario S1, where the control
of the existing allocation scheme in Beijing is maintained and tightened moderately
during the 13th Five-Year Plan period, the corresponding policy costs are a 0.56%
loss in total GDP and a 0.20% loss in GDP growth compared to the scenario of no
carbon trading.
87
Table 3.4 Moderate allowance allocation plan of scenario S1
2013
(%)
2014
(%)
2015
(%)
2016
(%)
2017
(%)
2018
(%)
2019
(%)
2020
(%)
Manufacturing
and mining
98
96
94
93.5
93.0
92.5
92.0
91.5
Tertiary industry 99
97
96
95.5
95.0
94.5
94.0
93.5
Gas-fired units of
CHP
100
100
100
99.5
99.0
98.5
98.0
97.5
Coal-fired units
of CHP
99.90
99.70
99.50
99.0
98.5
98.0
97.5
97.0
Gas-fired units of
heat suppliers
100
100
100
99.5
99.0
98.5
98.0
97.5
Coal-fired units
of heat suppliers
99.80
99.50
99.00
98.5
98.0
97.5
97.0
96.5
Table 3.5 Loose allowance allocation plan of scenario S2
2013
(%)
2014
(%)
2015
(%)
2016
(%)
2017
(%)
2018
(%)
2019
(%)
2020
(%)
Manufacturing
and mining
98.0
97.9
97.8
97.7
97.6
97.5
97.4
97.3
Tertiary industry 99
98.9
98.8
98.7
98.6
98.5
98.4
98.3
Gas-fired units of
CHP
100
100
100
99.5
99.0
98.5
98.0
97.5
Coal-fired units
of CHP
99.90
99.8
99.7
99.6
99.5
99.4
99.3
99.2
Gas-fired units of
heat suppliers
100
100
100
99.5
99.0
98.5
98.0
97.5
Coal-fired units
of heat suppliers
99.80
99.7
99.6
99.5
99.4
99.3
99.2
99.1
energy consumption, carbon emissions and other variables before and after the
implementation of carbon trading policy.
S2 scenario (loose allowance) S1 scenario (moderate allowance) (Fig. 3.15 and
Tables 3.6 and 3.7).
The above results (see Tables 3.6 and 3.7) shows that in the S2 scenario, excessively low carbon price features much weaker intervention on carbon emission
control, which makes the policy irrelevant; while in scenario S1, where the control
of the existing allocation scheme in Beijing is maintained and tightened moderately
during the 13th Five-Year Plan period, the corresponding policy costs are a 0.56%
loss in total GDP and a 0.20% loss in GDP growth compared to the scenario of no
carbon trading.