

54
J. Wu and H. Zhao
current development and trend of urban industrial structure, and define the impact
mechanism of different regional industrial structures on carbon emissions.
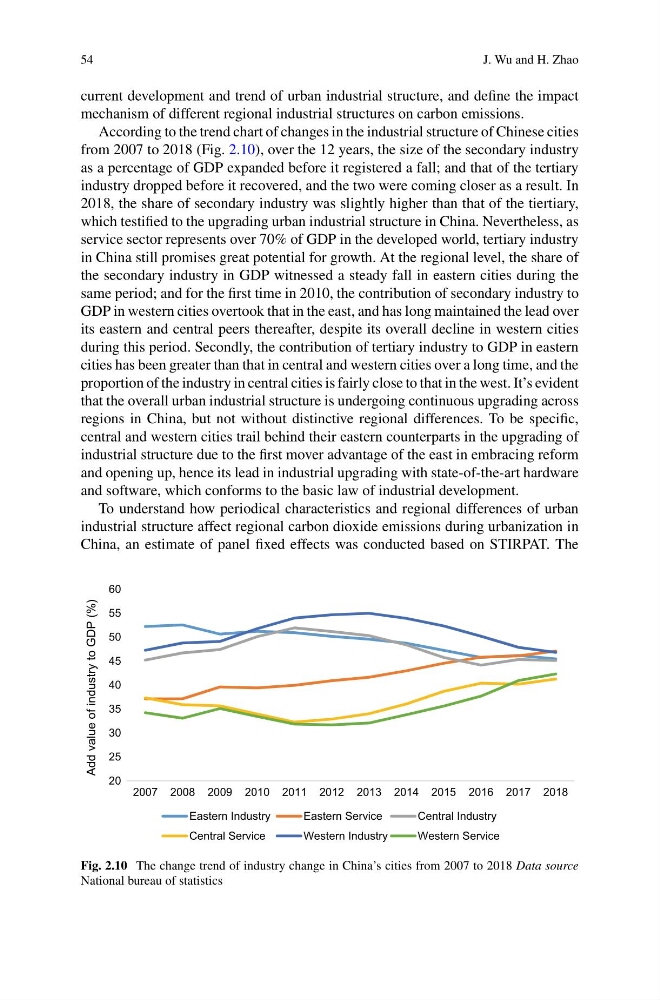
According to the trend chart of changes in the industrial structure of Chinese cities
from 2007 to 2018 (Fig. 2.10), over the 12 years, the size of the secondary industry
as a percentage of GDP expanded before it registered a fall; and that of the tertiary
industry dropped before it recovered, and the two were coming closer as a result. In
2018, the share of secondary industry was slightly higher than that of the tiertiary,
which testified to the upgrading urban industrial structure in China. Nevertheless, as
service sector represents over 70% of GDP in the developed world, tertiary industry
in China still promises great potential for growth. At the regional level, the share of
the secondary industry in GDP witnessed a steady fall in eastern cities during the
same period; and for the first time in 2010, the contribution of secondary industry to
GDP in western cities overtook that in the east, and has long maintained the lead over
its eastern and central peers thereafter, despite its overall decline in western cities
during this period. Secondly, the contribution of tertiary industry to GDP in eastern
cities has been greater than that in central and western cities over a long time, and the
proportion of the industry in central cities is fairly close to that in the west. It’s evident
that the overall urban industrial structure is undergoing continuous upgrading across
regions in China, but not without distinctive regional differences. To be specific,
central and western cities trail behind their eastern counterparts in the upgrading of
industrial structure due to the first mover advantage of the east in embracing reform
and opening up, hence its lead in industrial upgrading with state-of-the-art hardware
and software, which conforms to the basic law of industrial development.
To understand how periodical characteristics and regional differences of urban
industrial structure affect regional carbon dioxide emissions during urbanization in
China, an estimate of panel fixed effects was conducted based on STIRPAT. The
20
25
30
35
40
45
50
55
60
2007 2008 2009 2010 2011 2012 2013 2014 2015 2016 2017 2018
Add value of industry to GDP (%)
Eastern Industry
Eastern Service
Central Industry
Central Service
Western Industry
Western Service
Fig. 2.10 The change trend of industry change in China’s cities from 2007 to 2018 Data source
National bureau of statistics
J. Wu and H. Zhao
current development and trend of urban industrial structure, and define the impact
mechanism of different regional industrial structures on carbon emissions.
According to the trend chart of changes in the industrial structure of Chinese cities
from 2007 to 2018 (Fig. 2.10), over the 12 years, the size of the secondary industry
as a percentage of GDP expanded before it registered a fall; and that of the tertiary
industry dropped before it recovered, and the two were coming closer as a result. In
2018, the share of secondary industry was slightly higher than that of the tiertiary,
which testified to the upgrading urban industrial structure in China. Nevertheless, as
service sector represents over 70% of GDP in the developed world, tertiary industry
in China still promises great potential for growth. At the regional level, the share of
the secondary industry in GDP witnessed a steady fall in eastern cities during the
same period; and for the first time in 2010, the contribution of secondary industry to
GDP in western cities overtook that in the east, and has long maintained the lead over
its eastern and central peers thereafter, despite its overall decline in western cities
during this period. Secondly, the contribution of tertiary industry to GDP in eastern
cities has been greater than that in central and western cities over a long time, and the
proportion of the industry in central cities is fairly close to that in the west. It’s evident
that the overall urban industrial structure is undergoing continuous upgrading across
regions in China, but not without distinctive regional differences. To be specific,
central and western cities trail behind their eastern counterparts in the upgrading of
industrial structure due to the first mover advantage of the east in embracing reform
and opening up, hence its lead in industrial upgrading with state-of-the-art hardware
and software, which conforms to the basic law of industrial development.
To understand how periodical characteristics and regional differences of urban
industrial structure affect regional carbon dioxide emissions during urbanization in
China, an estimate of panel fixed effects was conducted based on STIRPAT. The
20
25
30
35
40
45
50
55
60
2007 2008 2009 2010 2011 2012 2013 2014 2015 2016 2017 2018
Add value of industry to GDP (%)
Eastern Industry
Eastern Service
Central Industry
Central Service
Western Industry
Western Service
Fig. 2.10 The change trend of industry change in China’s cities from 2007 to 2018 Data source
National bureau of statistics