

7 Development of Low Carbon Technology in China’s Iron …
219
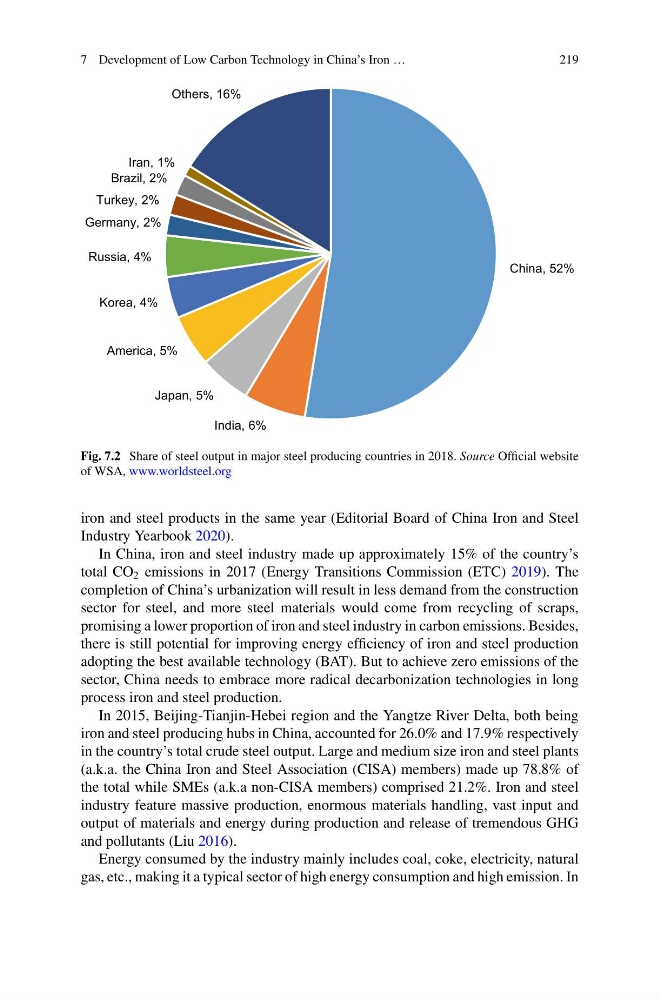
China, 52%
India, 6%
Japan, 5%
America, 5%
Korea, 4%
Russia, 4%
Germany, 2%
Turkey, 2%
Brazil, 2%
Iran, 1%
Others, 16%
Fig. 7.2 Share of steel output in major steel producing countries in 2018. Source Official website
of WSA, www.worldsteel.org
iron and steel products in the same year (Editorial Board of China Iron and Steel
Industry Yearbook 2020).
In China, iron and steel industry made up approximately 15% of the country’s
total CO 2 emissions in 2017 (Energy Transitions Commission (ETC) 2019). The
completion of China’s urbanization will result in less demand from the construction
sector for steel, and more steel materials would come from recycling of scraps,
promising a lower proportion of iron and steel industry in carbon emissions. Besides,
there is still potential for improving energy efficiency of iron and steel production
adopting the best available technology (BAT). But to achieve zero emissions of the
sector, China needs to embrace more radical decarbonization technologies in long
process iron and steel production.
In 2015, Beijing-Tianjin-Hebei region and the Yangtze River Delta, both being
iron and steel producing hubs in China, accounted for 26.0% and 17.9% respectively
in the country’s total crude steel output. Large and medium size iron and steel plants
(a.k.a. the China Iron and Steel Association (CISA) members) made up 78.8% of
the total while SMEs (a.k.a non-CISA members) comprised 21.2%. Iron and steel
industry feature massive production, enormous materials handling, vast input and
output of materials and energy during production and release of tremendous GHG
and pollutants (Liu 2016).
Energy consumed by the industry mainly includes coal, coke, electricity, natural
gas, etc., making it a typical sector of high energy consumption and high emission. In
219
China, 52%
India, 6%
Japan, 5%
America, 5%
Korea, 4%
Russia, 4%
Germany, 2%
Turkey, 2%
Brazil, 2%
Iran, 1%
Others, 16%
Fig. 7.2 Share of steel output in major steel producing countries in 2018. Source Official website
of WSA, www.worldsteel.org
iron and steel products in the same year (Editorial Board of China Iron and Steel
Industry Yearbook 2020).
In China, iron and steel industry made up approximately 15% of the country’s
total CO 2 emissions in 2017 (Energy Transitions Commission (ETC) 2019). The
completion of China’s urbanization will result in less demand from the construction
sector for steel, and more steel materials would come from recycling of scraps,
promising a lower proportion of iron and steel industry in carbon emissions. Besides,
there is still potential for improving energy efficiency of iron and steel production
adopting the best available technology (BAT). But to achieve zero emissions of the
sector, China needs to embrace more radical decarbonization technologies in long
process iron and steel production.
In 2015, Beijing-Tianjin-Hebei region and the Yangtze River Delta, both being
iron and steel producing hubs in China, accounted for 26.0% and 17.9% respectively
in the country’s total crude steel output. Large and medium size iron and steel plants
(a.k.a. the China Iron and Steel Association (CISA) members) made up 78.8% of
the total while SMEs (a.k.a non-CISA members) comprised 21.2%. Iron and steel
industry feature massive production, enormous materials handling, vast input and
output of materials and energy during production and release of tremendous GHG
and pollutants (Liu 2016).
Energy consumed by the industry mainly includes coal, coke, electricity, natural
gas, etc., making it a typical sector of high energy consumption and high emission. In