

6 The Impacts of Electric Vehicles …
207
Table 6.2 (continued)
Scenario S1
S2
S3
Metal
Li
Ni
Co Mn Li
Ni Co Mn Li
Ni
Co Mn
POECD 0.9
2.7 0.6 1.5 0.9 0.8 0.2 0.4 0.9
4.3 0.8 0.4
EAS
3.3
9.2 2.1 5.2 3.2 2.7 0.6 1.5 3.1 14.9 2.9 1.2
SAS
4.0 11.6 2.7 6.5 3.9 3.4 0.8 1.9 3.8 18.7 3.6 1.5
PAS
2.5
7.2 1.7 4.1 2.4 2.1 0.5 1.2 2.3 11.8 2.3 1.0
LAM
2.9
8.6 2.0 4.8 2.8 2.5 0.6 1.4 2.7 13.9 2.7 1.1
EIT
0.9
2.5 0.6 1.4 0.8 0.7 0.2 0.4 0.8
4.1 0.8 0.3
SSA
2.9
8.7 2.0 4.9 2.9 2.6 0.6 1.4 2.8 14.1 2.7 1.2
MNA
2.1
6.1 1.4 3.4 2.0 1.8 0.4 1.0 1.9
9.9 1.9 0.8
World
26.1 75.1 17.3 42.3 25.3 22.1 5.1 12.5 24.5 121.9 23.7 10.0
This study defines the ratio between primary resources exploitation associated
with the above net demand and the currently identified resources as demand-reserve
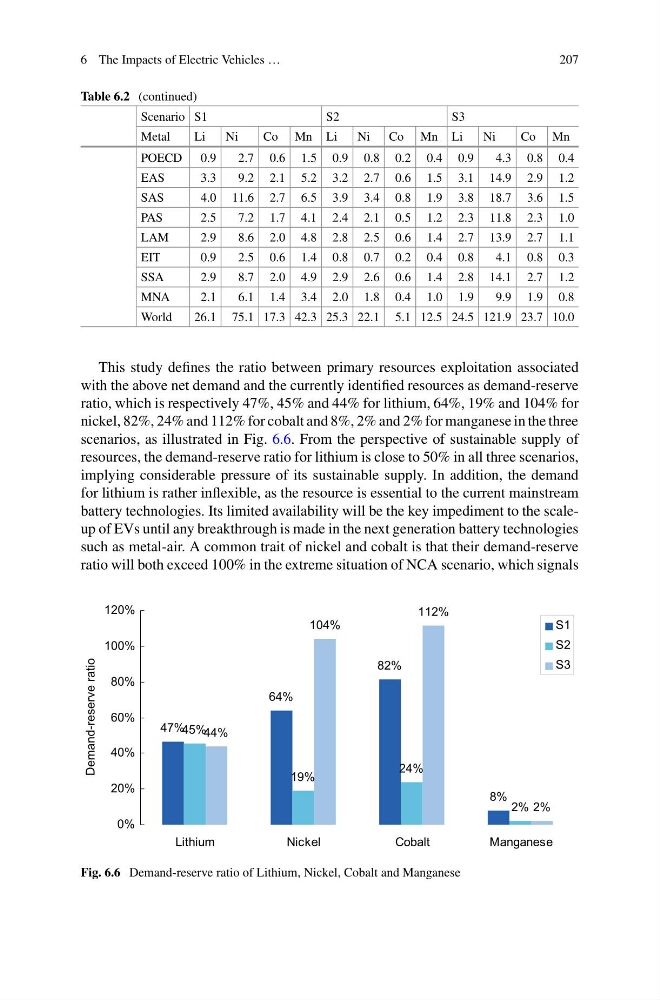
ratio, which is respectively 47%, 45% and 44% for lithium, 64%, 19% and 104% for
nickel, 82%, 24% and 112% for cobalt and 8%, 2% and 2% for manganese in the three
scenarios, as illustrated in Fig. 6.6. From the perspective of sustainable supply of
resources, the demand-reserve ratio for lithium is close to 50% in all three scenarios,
implying considerable pressure of its sustainable supply. In addition, the demand
for lithium is rather inflexible, as the resource is essential to the current mainstream
battery technologies. Its limited availability will be the key impediment to the scaleup of EVs until any breakthrough is made in the next generation battery technologies
such as metal-air. A common trait of nickel and cobalt is that their demand-reserve
ratio will both exceed 100% in the extreme situation of NCA scenario, which signals
47%
64%
82%
8%
45%
19%
24%
2%
44%
104%
112%
2%
0%
20%
40%
60%
80%
100%
120%
Lithium
Nickel
Cobalt
Manganese
Demand-reserve ratio
S1
S2
S3
Fig. 6.6 Demand-reserve ratio of Lithium, Nickel, Cobalt and Manganese
207
Table 6.2 (continued)
Scenario S1
S2
S3
Metal
Li
Ni
Co Mn Li
Ni Co Mn Li
Ni
Co Mn
POECD 0.9
2.7 0.6 1.5 0.9 0.8 0.2 0.4 0.9
4.3 0.8 0.4
EAS
3.3
9.2 2.1 5.2 3.2 2.7 0.6 1.5 3.1 14.9 2.9 1.2
SAS
4.0 11.6 2.7 6.5 3.9 3.4 0.8 1.9 3.8 18.7 3.6 1.5
PAS
2.5
7.2 1.7 4.1 2.4 2.1 0.5 1.2 2.3 11.8 2.3 1.0
LAM
2.9
8.6 2.0 4.8 2.8 2.5 0.6 1.4 2.7 13.9 2.7 1.1
EIT
0.9
2.5 0.6 1.4 0.8 0.7 0.2 0.4 0.8
4.1 0.8 0.3
SSA
2.9
8.7 2.0 4.9 2.9 2.6 0.6 1.4 2.8 14.1 2.7 1.2
MNA
2.1
6.1 1.4 3.4 2.0 1.8 0.4 1.0 1.9
9.9 1.9 0.8
World
26.1 75.1 17.3 42.3 25.3 22.1 5.1 12.5 24.5 121.9 23.7 10.0
This study defines the ratio between primary resources exploitation associated
with the above net demand and the currently identified resources as demand-reserve
ratio, which is respectively 47%, 45% and 44% for lithium, 64%, 19% and 104% for
nickel, 82%, 24% and 112% for cobalt and 8%, 2% and 2% for manganese in the three
scenarios, as illustrated in Fig. 6.6. From the perspective of sustainable supply of
resources, the demand-reserve ratio for lithium is close to 50% in all three scenarios,
implying considerable pressure of its sustainable supply. In addition, the demand
for lithium is rather inflexible, as the resource is essential to the current mainstream
battery technologies. Its limited availability will be the key impediment to the scaleup of EVs until any breakthrough is made in the next generation battery technologies
such as metal-air. A common trait of nickel and cobalt is that their demand-reserve
ratio will both exceed 100% in the extreme situation of NCA scenario, which signals
47%
64%
82%
8%
45%
19%
24%
2%
44%
104%
112%
2%
0%
20%
40%
60%
80%
100%
120%
Lithium
Nickel
Cobalt
Manganese
Demand-reserve ratio
S1
S2
S3
Fig. 6.6 Demand-reserve ratio of Lithium, Nickel, Cobalt and Manganese