

202
H. Hao and X. Sun
drastic price fluctuations of the industrial chain occured due to resources shortage?
To what extent will such shortage be eased by circular economy and other policy
measures? Clear answers are needed for these questions.
Second, supply risk. The geographical distribution of natural resources such as
lithium, nickel and cobalt is relatively concentrated, meaning that countries and
regions with inadequate resources may still be heavily dependent on import despite
the adequate global supply in supporting EV development. And this would imply
potential risks of supply interruption stemming from economic, political or military
issues of the exporting country, jeopardizing the industrial chain of the importer.
Given the above considerations, this chapter will provide a scientific assessment
of the sustainability and supply risk based on the projection of EV-associated demand
for critical metal resources.
6.2 Demand Projection and Sustainability Assessment
of Critical Metals
6.2.1 Projection Method and Basic Assumptions
Demand for critical metal resources driven by EV development hinges on multiple
technological, market and policy factors, calling for a simulation through bottom-up
modeling with elaborated technical details. For this purpose, the research taskforce
built a bottom-up technological model of global light-duty vehicle fleets, in which
detailed technical data of vehicle electrification and battery technological development are embedded to simulate the resources demand associated with EV development on a large time scale (2000–2100) and geographical span (140 countries). The
model is elaborated in (Hao et al. 2019a, b).
Core basic assumptions in this study comprise vehicle sales, ownership and retirement, EV market penetration, EV electric range, battery technological development,
recycling rate of battery materials, etc., which produce the largest impact on the future
demand for critical metals. Based on modeling simulation and expert predictions,
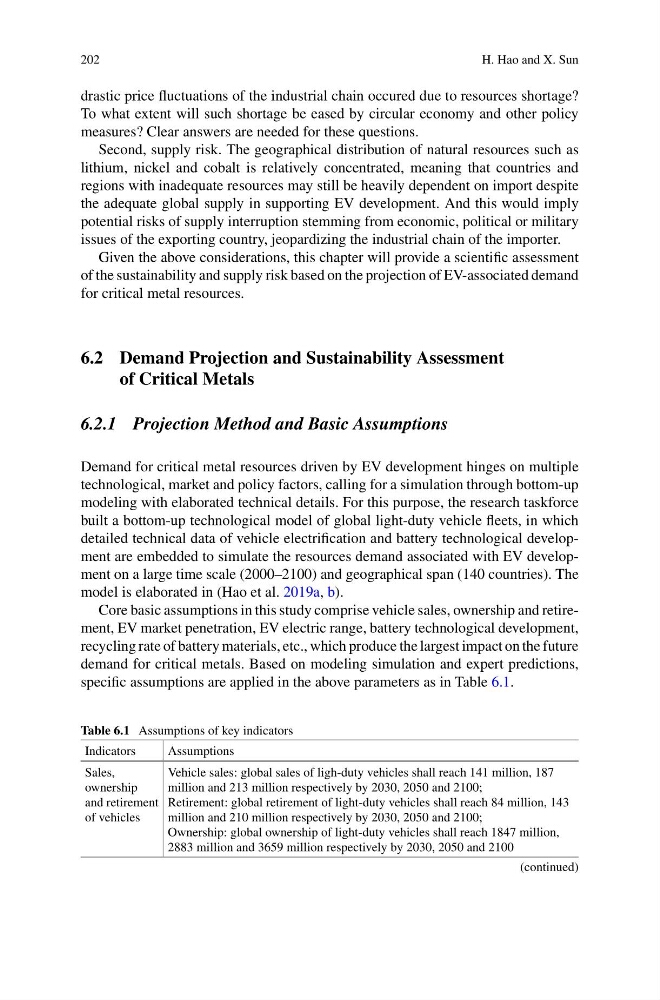
specific assumptions are applied in the above parameters as in Table 6.1.
Table 6.1 Assumptions of key indicators
Indicators
Assumptions
Sales,
ownership
and retirement
of vehicles
Vehicle sales: global sales of ligh-duty vehicles shall reach 141 million, 187
million and 213 million respectively by 2030, 2050 and 2100;
Retirement: global retirement of light-duty vehicles shall reach 84 million, 143
million and 210 million respectively by 2030, 2050 and 2100;
Ownership: global ownership of light-duty vehicles shall reach 1847 million,
2883 million and 3659 million respectively by 2030, 2050 and 2100
(continued)
H. Hao and X. Sun
drastic price fluctuations of the industrial chain occured due to resources shortage?
To what extent will such shortage be eased by circular economy and other policy
measures? Clear answers are needed for these questions.
Second, supply risk. The geographical distribution of natural resources such as
lithium, nickel and cobalt is relatively concentrated, meaning that countries and
regions with inadequate resources may still be heavily dependent on import despite
the adequate global supply in supporting EV development. And this would imply
potential risks of supply interruption stemming from economic, political or military
issues of the exporting country, jeopardizing the industrial chain of the importer.
Given the above considerations, this chapter will provide a scientific assessment
of the sustainability and supply risk based on the projection of EV-associated demand
for critical metal resources.
6.2 Demand Projection and Sustainability Assessment
of Critical Metals
6.2.1 Projection Method and Basic Assumptions
Demand for critical metal resources driven by EV development hinges on multiple
technological, market and policy factors, calling for a simulation through bottom-up
modeling with elaborated technical details. For this purpose, the research taskforce
built a bottom-up technological model of global light-duty vehicle fleets, in which
detailed technical data of vehicle electrification and battery technological development are embedded to simulate the resources demand associated with EV development on a large time scale (2000–2100) and geographical span (140 countries). The
model is elaborated in (Hao et al. 2019a, b).
Core basic assumptions in this study comprise vehicle sales, ownership and retirement, EV market penetration, EV electric range, battery technological development,
recycling rate of battery materials, etc., which produce the largest impact on the future
demand for critical metals. Based on modeling simulation and expert predictions,
specific assumptions are applied in the above parameters as in Table 6.1.
Table 6.1 Assumptions of key indicators
Indicators
Assumptions
Sales,
ownership
and retirement
of vehicles
Vehicle sales: global sales of ligh-duty vehicles shall reach 141 million, 187
million and 213 million respectively by 2030, 2050 and 2100;
Retirement: global retirement of light-duty vehicles shall reach 84 million, 143
million and 210 million respectively by 2030, 2050 and 2100;
Ownership: global ownership of light-duty vehicles shall reach 1847 million,
2883 million and 3659 million respectively by 2030, 2050 and 2100
(continued)