

196
H. Hao and X. Sun
0
500
1000
1500
2000
2500
2010 2011 2012 2013 2014 2015 2016 2017 2018 2019
EV sales / thousand
0%
10%
20%
30%
40%
50%
60%
70%
Share
Global sales
China sales
China sales out of global sales
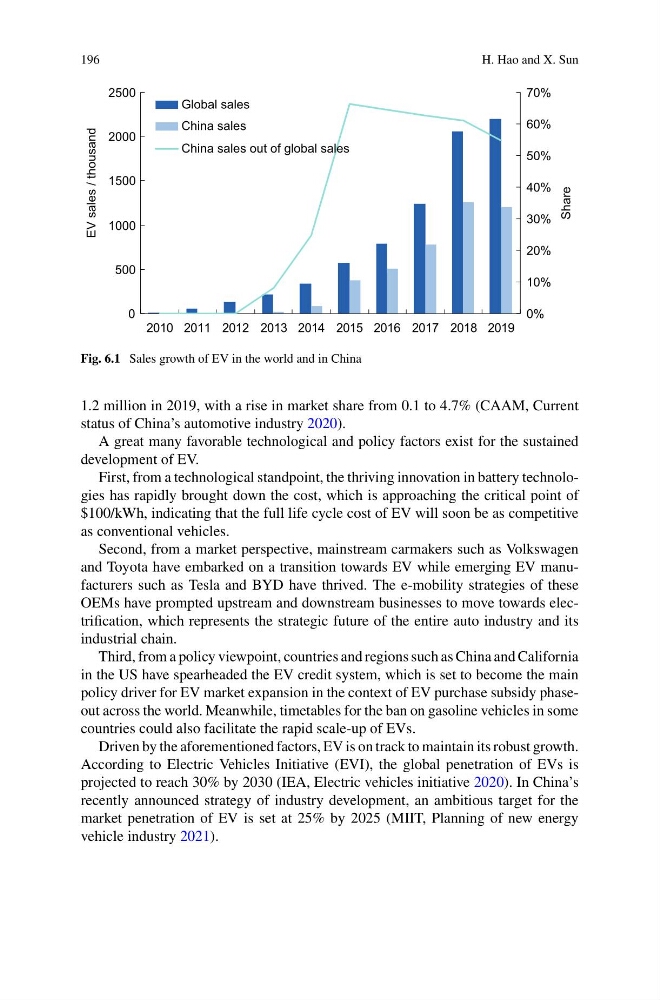
Fig. 6.1 Sales growth of EV in the world and in China
1.2 million in 2019, with a rise in market share from 0.1 to 4.7% (CAAM, Current
status of China’s automotive industry 2020).
A great many favorable technological and policy factors exist for the sustained
development of EV.
First, from a technological standpoint, the thriving innovation in battery technologies has rapidly brought down the cost, which is approaching the critical point of
$100/kWh, indicating that the full life cycle cost of EV will soon be as competitive
as conventional vehicles.
Second, from a market perspective, mainstream carmakers such as Volkswagen
and Toyota have embarked on a transition towards EV while emerging EV manufacturers such as Tesla and BYD have thrived. The e-mobility strategies of these
OEMs have prompted upstream and downstream businesses to move towards electrification, which represents the strategic future of the entire auto industry and its
industrial chain.
Third, from a policy viewpoint, countries and regions such as China and California
in the US have spearheaded the EV credit system, which is set to become the main
policy driver for EV market expansion in the context of EV purchase subsidy phaseout across the world. Meanwhile, timetables for the ban on gasoline vehicles in some
countries could also facilitate the rapid scale-up of EVs.
Driven by the aforementioned factors, EV is on track to maintain its robust growth.
According to Electric Vehicles Initiative (EVI), the global penetration of EVs is
projected to reach 30% by 2030 (IEA, Electric vehicles initiative 2020). In China’s
recently announced strategy of industry development, an ambitious target for the
market penetration of EV is set at 25% by 2025 (MIIT, Planning of new energy
vehicle industry 2021).
H. Hao and X. Sun
0
500
1000
1500
2000
2500
2010 2011 2012 2013 2014 2015 2016 2017 2018 2019
EV sales / thousand
0%
10%
20%
30%
40%
50%
60%
70%
Share
Global sales
China sales
China sales out of global sales
Fig. 6.1 Sales growth of EV in the world and in China
1.2 million in 2019, with a rise in market share from 0.1 to 4.7% (CAAM, Current
status of China’s automotive industry 2020).
A great many favorable technological and policy factors exist for the sustained
development of EV.
First, from a technological standpoint, the thriving innovation in battery technologies has rapidly brought down the cost, which is approaching the critical point of
$100/kWh, indicating that the full life cycle cost of EV will soon be as competitive
as conventional vehicles.
Second, from a market perspective, mainstream carmakers such as Volkswagen
and Toyota have embarked on a transition towards EV while emerging EV manufacturers such as Tesla and BYD have thrived. The e-mobility strategies of these
OEMs have prompted upstream and downstream businesses to move towards electrification, which represents the strategic future of the entire auto industry and its
industrial chain.
Third, from a policy viewpoint, countries and regions such as China and California
in the US have spearheaded the EV credit system, which is set to become the main
policy driver for EV market expansion in the context of EV purchase subsidy phaseout across the world. Meanwhile, timetables for the ban on gasoline vehicles in some
countries could also facilitate the rapid scale-up of EVs.
Driven by the aforementioned factors, EV is on track to maintain its robust growth.
According to Electric Vehicles Initiative (EVI), the global penetration of EVs is
projected to reach 30% by 2030 (IEA, Electric vehicles initiative 2020). In China’s
recently announced strategy of industry development, an ambitious target for the
market penetration of EV is set at 25% by 2025 (MIIT, Planning of new energy
vehicle industry 2021).