

8
L. Ma et al.
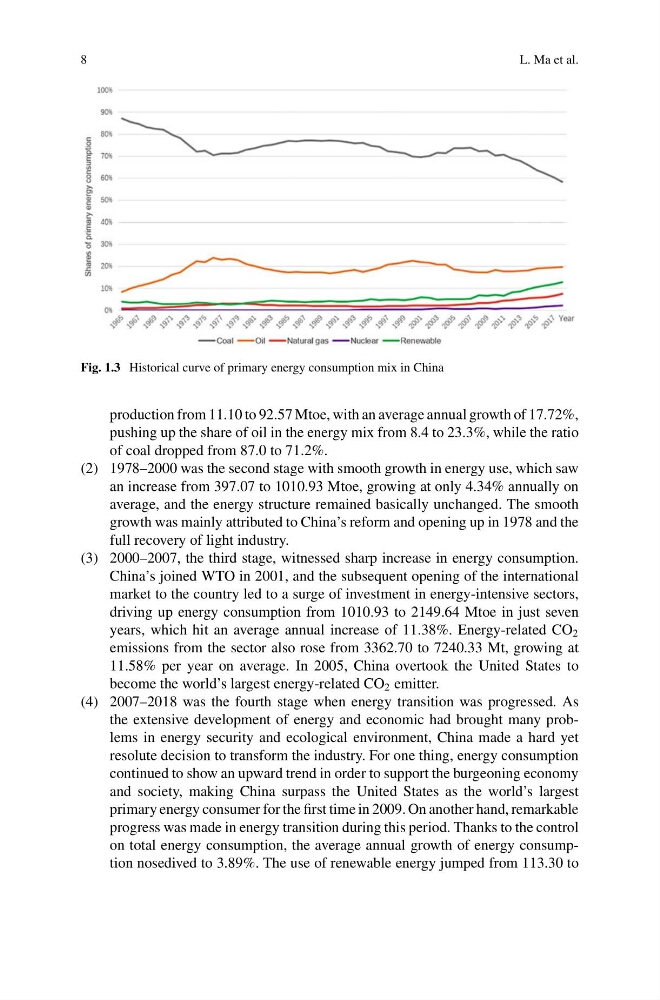
Fig. 1.3 Historical curve of primary energy consumption mix in China
production from 11.10 to 92.57 Mtoe, with an average annual growth of 17.72%,
pushing up the share of oil in the energy mix from 8.4 to 23.3%, while the ratio
of coal dropped from 87.0 to 71.2%.
(2) 1978–2000 was the second stage with smooth growth in energy use, which saw
an increase from 397.07 to 1010.93 Mtoe, growing at only 4.34% annually on
average, and the energy structure remained basically unchanged. The smooth
growth was mainly attributed to China’s reform and opening up in 1978 and the
full recovery of light industry.
(3) 2000–2007, the third stage, witnessed sharp increase in energy consumption.
China’s joined WTO in 2001, and the subsequent opening of the international
market to the country led to a surge of investment in energy-intensive sectors,
driving up energy consumption from 1010.93 to 2149.64 Mtoe in just seven
years, which hit an average annual increase of 11.38%. Energy-related CO 2
emissions from the sector also rose from 3362.70 to 7240.33 Mt, growing at
11.58% per year on average. In 2005, China overtook the United States to
become the world’s largest energy-related CO 2 emitter.
(4) 2007–2018 was the fourth stage when energy transition was progressed. As
the extensive development of energy and economic had brought many problems in energy security and ecological environment, China made a hard yet
resolute decision to transform the industry. For one thing, energy consumption
continued to show an upward trend in order to support the burgeoning economy
and society, making China surpass the United States as the world’s largest
primary energy consumer for the first time in 2009. On another hand, remarkable
progress was made in energy transition during this period. Thanks to the control
on total energy consumption, the average annual growth of energy consumption nosedived to 3.89%. The use of renewable energy jumped from 113.30 to
L. Ma et al.
Fig. 1.3 Historical curve of primary energy consumption mix in China
production from 11.10 to 92.57 Mtoe, with an average annual growth of 17.72%,
pushing up the share of oil in the energy mix from 8.4 to 23.3%, while the ratio
of coal dropped from 87.0 to 71.2%.
(2) 1978–2000 was the second stage with smooth growth in energy use, which saw
an increase from 397.07 to 1010.93 Mtoe, growing at only 4.34% annually on
average, and the energy structure remained basically unchanged. The smooth
growth was mainly attributed to China’s reform and opening up in 1978 and the
full recovery of light industry.
(3) 2000–2007, the third stage, witnessed sharp increase in energy consumption.
China’s joined WTO in 2001, and the subsequent opening of the international
market to the country led to a surge of investment in energy-intensive sectors,
driving up energy consumption from 1010.93 to 2149.64 Mtoe in just seven
years, which hit an average annual increase of 11.38%. Energy-related CO 2
emissions from the sector also rose from 3362.70 to 7240.33 Mt, growing at
11.58% per year on average. In 2005, China overtook the United States to
become the world’s largest energy-related CO 2 emitter.
(4) 2007–2018 was the fourth stage when energy transition was progressed. As
the extensive development of energy and economic had brought many problems in energy security and ecological environment, China made a hard yet
resolute decision to transform the industry. For one thing, energy consumption
continued to show an upward trend in order to support the burgeoning economy
and society, making China surpass the United States as the world’s largest
primary energy consumer for the first time in 2009. On another hand, remarkable
progress was made in energy transition during this period. Thanks to the control
on total energy consumption, the average annual growth of energy consumption nosedived to 3.89%. The use of renewable energy jumped from 113.30 to