

1 China’s Energy Transition Strategy in the Context of Global …
7
1.3 The Past, Present and Future of China’s Energy System
This section begins with a review of the history of China’s energy system and its
recent development, with a breakdown of historical stages. Secondly, the Sankey
diagram tool was adopted to draw a full picture of China’s energy flow, followed by
analysis of the structural changes of the energy system from 2005 to 2015. Finally,
the section explores the future direction for China’s energy development, proposing
a new concept named as “3+1” for energy system integration.
1.3.1 The History of China’s Energy System
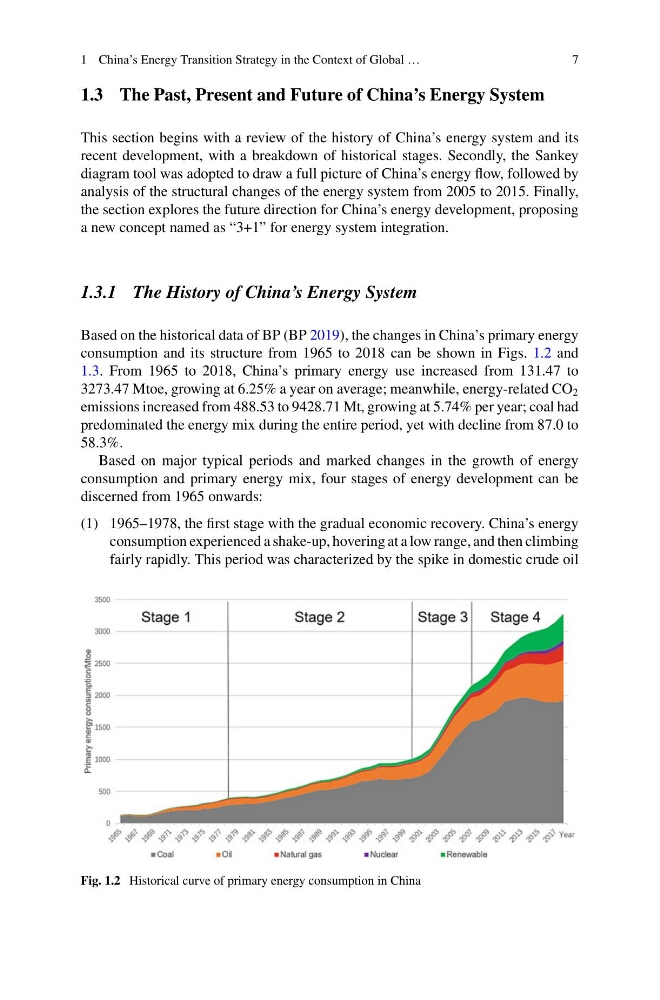
Based on the historical data of BP (BP 2019), the changes in China’s primary energy
consumption and its structure from 1965 to 2018 can be shown in Figs. 1.2 and
1.3. From 1965 to 2018, China’s primary energy use increased from 131.47 to
3273.47 Mtoe, growing at 6.25% a year on average; meanwhile, energy-related CO 2
emissions increased from 488.53 to 9428.71 Mt, growing at 5.74% per year; coal had
predominated the energy mix during the entire period, yet with decline from 87.0 to
58.3%.
Based on major typical periods and marked changes in the growth of energy
consumption and primary energy mix, four stages of energy development can be
discerned from 1965 onwards:
(1) 1965–1978, the first stage with the gradual economic recovery. China’s energy
consumption experienced a shake-up, hovering at a low range, and then climbing
fairly rapidly. This period was characterized by the spike in domestic crude oil
Fig. 1.2 Historical curve of primary energy consumption in China
7
1.3 The Past, Present and Future of China’s Energy System
This section begins with a review of the history of China’s energy system and its
recent development, with a breakdown of historical stages. Secondly, the Sankey
diagram tool was adopted to draw a full picture of China’s energy flow, followed by
analysis of the structural changes of the energy system from 2005 to 2015. Finally,
the section explores the future direction for China’s energy development, proposing
a new concept named as “3+1” for energy system integration.
1.3.1 The History of China’s Energy System
Based on the historical data of BP (BP 2019), the changes in China’s primary energy
consumption and its structure from 1965 to 2018 can be shown in Figs. 1.2 and
1.3. From 1965 to 2018, China’s primary energy use increased from 131.47 to
3273.47 Mtoe, growing at 6.25% a year on average; meanwhile, energy-related CO 2
emissions increased from 488.53 to 9428.71 Mt, growing at 5.74% per year; coal had
predominated the energy mix during the entire period, yet with decline from 87.0 to
58.3%.
Based on major typical periods and marked changes in the growth of energy
consumption and primary energy mix, four stages of energy development can be
discerned from 1965 onwards:
(1) 1965–1978, the first stage with the gradual economic recovery. China’s energy
consumption experienced a shake-up, hovering at a low range, and then climbing
fairly rapidly. This period was characterized by the spike in domestic crude oil
Fig. 1.2 Historical curve of primary energy consumption in China