

5 Reality and Challenges of China’s Water Resources Management …
179
45
45
42
40
39
39
38
15
17
17
18
18
18
20
9
11
11
12
12
12
12
31
31
31
31
31
31
31
29
32
34
37
40
42
45
19
19
19
20
21
21
21
0
20
40
60
80
100
120
140
160
180
200
2012
2013
2014
2015
2016
2017
2018
m 3
per capita
Grains
Meats
Aquatic products
Dairy product& eggs
Vegetables& fruits
Other foods
Other foods and dervices
Direct water consumption
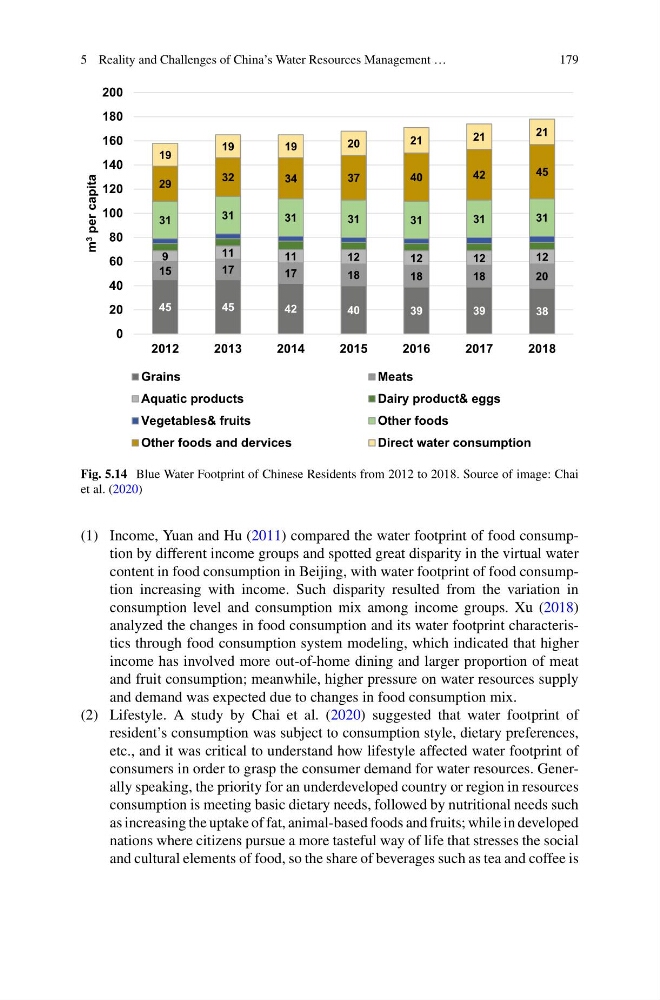
Fig. 5.14 Blue Water Footprint of Chinese Residents from 2012 to 2018. Source of image: Chai
et al. (2020)
(1) Income, Yuan and Hu (2011) compared the water footprint of food consumption by different income groups and spotted great disparity in the virtual water
content in food consumption in Beijing, with water footprint of food consumption increasing with income. Such disparity resulted from the variation in
consumption level and consumption mix among income groups. Xu (2018)
analyzed the changes in food consumption and its water footprint characteristics through food consumption system modeling, which indicated that higher
income has involved more out-of-home dining and larger proportion of meat
and fruit consumption; meanwhile, higher pressure on water resources supply
and demand was expected due to changes in food consumption mix.
(2) Lifestyle. A study by Chai et al. (2020) suggested that water footprint of
resident’s consumption was subject to consumption style, dietary preferences,
etc., and it was critical to understand how lifestyle affected water footprint of
consumers in order to grasp the consumer demand for water resources. Generally speaking, the priority for an underdeveloped country or region in resources
consumption is meeting basic dietary needs, followed by nutritional needs such
as increasing the uptake of fat, animal-based foods and fruits; while in developed
nations where citizens pursue a more tasteful way of life that stresses the social
and cultural elements of food, so the share of beverages such as tea and coffee is
179
45
45
42
40
39
39
38
15
17
17
18
18
18
20
9
11
11
12
12
12
12
31
31
31
31
31
31
31
29
32
34
37
40
42
45
19
19
19
20
21
21
21
0
20
40
60
80
100
120
140
160
180
200
2012
2013
2014
2015
2016
2017
2018
m 3
per capita
Grains
Meats
Aquatic products
Dairy product& eggs
Vegetables& fruits
Other foods
Other foods and dervices
Direct water consumption
Fig. 5.14 Blue Water Footprint of Chinese Residents from 2012 to 2018. Source of image: Chai
et al. (2020)
(1) Income, Yuan and Hu (2011) compared the water footprint of food consumption by different income groups and spotted great disparity in the virtual water
content in food consumption in Beijing, with water footprint of food consumption increasing with income. Such disparity resulted from the variation in
consumption level and consumption mix among income groups. Xu (2018)
analyzed the changes in food consumption and its water footprint characteristics through food consumption system modeling, which indicated that higher
income has involved more out-of-home dining and larger proportion of meat
and fruit consumption; meanwhile, higher pressure on water resources supply
and demand was expected due to changes in food consumption mix.
(2) Lifestyle. A study by Chai et al. (2020) suggested that water footprint of
resident’s consumption was subject to consumption style, dietary preferences,
etc., and it was critical to understand how lifestyle affected water footprint of
consumers in order to grasp the consumer demand for water resources. Generally speaking, the priority for an underdeveloped country or region in resources
consumption is meeting basic dietary needs, followed by nutritional needs such
as increasing the uptake of fat, animal-based foods and fruits; while in developed
nations where citizens pursue a more tasteful way of life that stresses the social
and cultural elements of food, so the share of beverages such as tea and coffee is