

178
W. Cai et al.
that water footprint of agro-products was constantly rising for urban residents but
declining for rural dwellers. Total water footprint of agro-product consumption in
urban areas rose from 129.8 billion m
3 in 1990 to 378.44 billion m
3 in 2015, and
that in rural areas dropped from 362.91 billion m
3 to 272.73 billion m
3 during the
same period. In terms of contributors of water footprint, from 1990 to 2015, the size
of urban population, urban consumption structure and rural consumption structure
were the key drivers for rising water footprint of agro-product consumption, of which
the size of urban population stood out most. Consumption other than food, on the
other hand, contributed less to water footprint. As was vividly illustrated by Chai
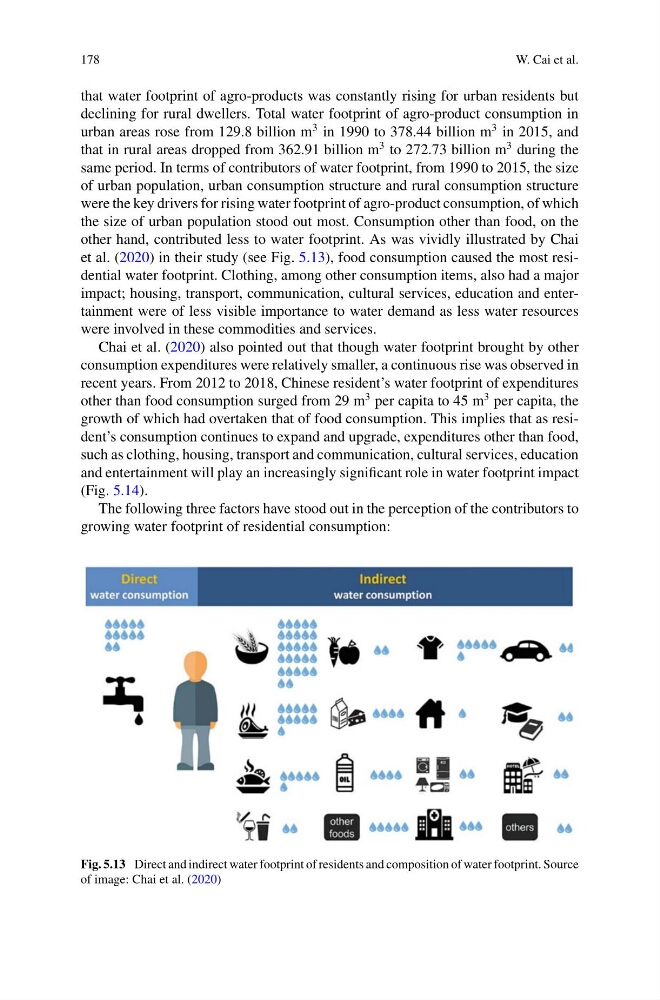
et al. (2020) in their study (see Fig. 5.13), food consumption caused the most residential water footprint. Clothing, among other consumption items, also had a major
impact; housing, transport, communication, cultural services, education and entertainment were of less visible importance to water demand as less water resources
were involved in these commodities and services.
Chai et al. (2020) also pointed out that though water footprint brought by other
consumption expenditures were relatively smaller, a continuous rise was observed in
recent years. From 2012 to 2018, Chinese resident’s water footprint of expenditures
other than food consumption surged from 29 m
3 per capita to 45 m
3 per capita, the
growth of which had overtaken that of food consumption. This implies that as resident’s consumption continues to expand and upgrade, expenditures other than food,
such as clothing, housing, transport and communication, cultural services, education
and entertainment will play an increasingly significant role in water footprint impact
(Fig. 5.14).
The following three factors have stood out in the perception of the contributors to
growing water footprint of residential consumption:
Fig. 5.13 Direct and indirect water footprint of residents and composition of water footprint. Source
of image: Chai et al. (2020)
W. Cai et al.
that water footprint of agro-products was constantly rising for urban residents but
declining for rural dwellers. Total water footprint of agro-product consumption in
urban areas rose from 129.8 billion m
3 in 1990 to 378.44 billion m
3 in 2015, and
that in rural areas dropped from 362.91 billion m
3 to 272.73 billion m
3 during the
same period. In terms of contributors of water footprint, from 1990 to 2015, the size
of urban population, urban consumption structure and rural consumption structure
were the key drivers for rising water footprint of agro-product consumption, of which
the size of urban population stood out most. Consumption other than food, on the
other hand, contributed less to water footprint. As was vividly illustrated by Chai
et al. (2020) in their study (see Fig. 5.13), food consumption caused the most residential water footprint. Clothing, among other consumption items, also had a major
impact; housing, transport, communication, cultural services, education and entertainment were of less visible importance to water demand as less water resources
were involved in these commodities and services.
Chai et al. (2020) also pointed out that though water footprint brought by other
consumption expenditures were relatively smaller, a continuous rise was observed in
recent years. From 2012 to 2018, Chinese resident’s water footprint of expenditures
other than food consumption surged from 29 m
3 per capita to 45 m
3 per capita, the
growth of which had overtaken that of food consumption. This implies that as resident’s consumption continues to expand and upgrade, expenditures other than food,
such as clothing, housing, transport and communication, cultural services, education
and entertainment will play an increasingly significant role in water footprint impact
(Fig. 5.14).
The following three factors have stood out in the perception of the contributors to
growing water footprint of residential consumption:
Fig. 5.13 Direct and indirect water footprint of residents and composition of water footprint. Source
of image: Chai et al. (2020)