

4 The Transition of China’s Power System
149
0
10000
20000
30000
40000
50000
60000
70000
80000
Power consumption: 100 million kWh
2000-2018 Power Consumption in China
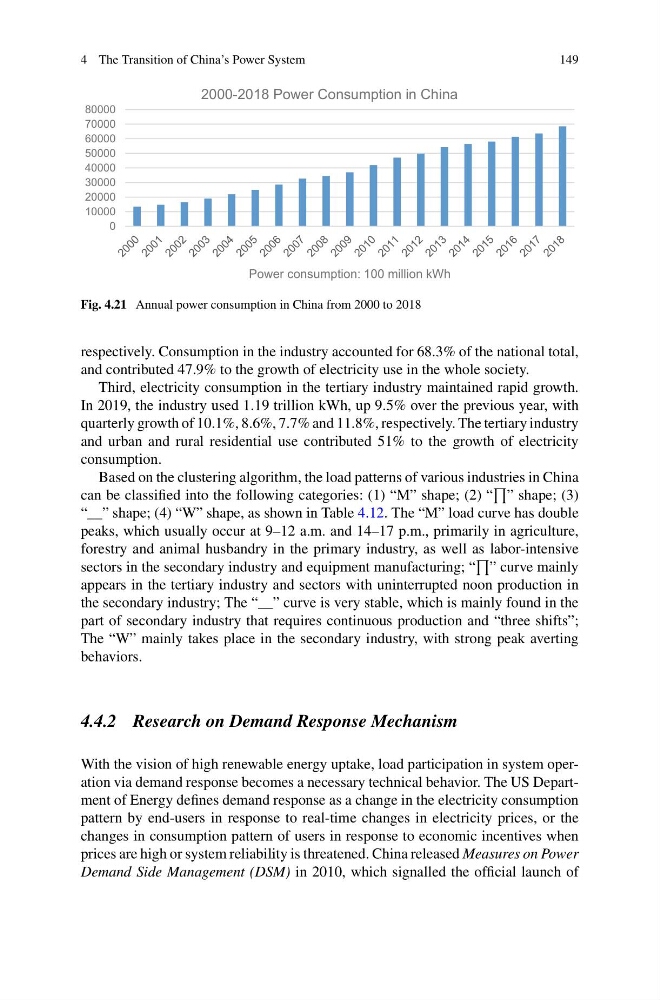
Fig. 4.21 Annual power consumption in China from 2000 to 2018
respectively. Consumption in the industry accounted for 68.3% of the national total,
and contributed 47.9% to the growth of electricity use in the whole society.
Third, electricity consumption in the tertiary industry maintained rapid growth.
In 2019, the industry used 1.19 trillion kWh, up 9.5% over the previous year, with
quarterly growth of 10.1%, 8.6%, 7.7% and 11.8%, respectively. The tertiary industry
and urban and rural residential use contributed 51% to the growth of electricity
consumption.
Based on the clustering algorithm, the load patterns of various industries in China
can be classified into the following categories: (1) “M” shape; (2) “
” shape; (3)
“__” shape; (4) “W” shape, as shown in Table 4.12. The “M” load curve has double
peaks, which usually occur at 9–12 a.m. and 14–17 p.m., primarily in agriculture,
forestry and animal husbandry in the primary industry, as well as labor-intensive
sectors in the secondary industry and equipment manufacturing; “
” curve mainly
appears in the tertiary industry and sectors with uninterrupted noon production in
the secondary industry; The “__” curve is very stable, which is mainly found in the
part of secondary industry that requires continuous production and “three shifts”;
The “W” mainly takes place in the secondary industry, with strong peak averting
behaviors.
4.4.2 Research on Demand Response Mechanism
With the vision of high renewable energy uptake, load participation in system operation via demand response becomes a necessary technical behavior. The US Department of Energy defines demand response as a change in the electricity consumption
pattern by end-users in response to real-time changes in electricity prices, or the
changes in consumption pattern of users in response to economic incentives when
prices are high or system reliability is threatened. China released Measures on Power
Demand Side Management (DSM) in 2010, which signalled the official launch of
149
0
10000
20000
30000
40000
50000
60000
70000
80000
Power consumption: 100 million kWh
2000-2018 Power Consumption in China
Fig. 4.21 Annual power consumption in China from 2000 to 2018
respectively. Consumption in the industry accounted for 68.3% of the national total,
and contributed 47.9% to the growth of electricity use in the whole society.
Third, electricity consumption in the tertiary industry maintained rapid growth.
In 2019, the industry used 1.19 trillion kWh, up 9.5% over the previous year, with
quarterly growth of 10.1%, 8.6%, 7.7% and 11.8%, respectively. The tertiary industry
and urban and rural residential use contributed 51% to the growth of electricity
consumption.
Based on the clustering algorithm, the load patterns of various industries in China
can be classified into the following categories: (1) “M” shape; (2) “
” shape; (3)
“__” shape; (4) “W” shape, as shown in Table 4.12. The “M” load curve has double
peaks, which usually occur at 9–12 a.m. and 14–17 p.m., primarily in agriculture,
forestry and animal husbandry in the primary industry, as well as labor-intensive
sectors in the secondary industry and equipment manufacturing; “
” curve mainly
appears in the tertiary industry and sectors with uninterrupted noon production in
the secondary industry; The “__” curve is very stable, which is mainly found in the
part of secondary industry that requires continuous production and “three shifts”;
The “W” mainly takes place in the secondary industry, with strong peak averting
behaviors.
4.4.2 Research on Demand Response Mechanism
With the vision of high renewable energy uptake, load participation in system operation via demand response becomes a necessary technical behavior. The US Department of Energy defines demand response as a change in the electricity consumption
pattern by end-users in response to real-time changes in electricity prices, or the
changes in consumption pattern of users in response to economic incentives when
prices are high or system reliability is threatened. China released Measures on Power
Demand Side Management (DSM) in 2010, which signalled the official launch of