

140
Z. Lu and G. Zhu
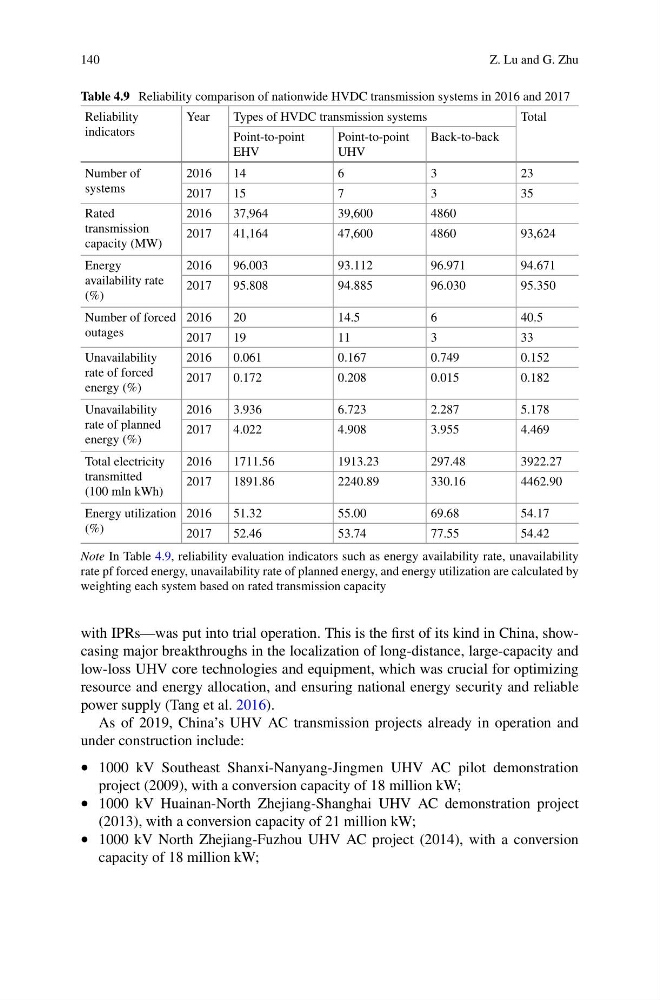
Table 4.9 Reliability comparison of nationwide HVDC transmission systems in 2016 and 2017
Reliability
indicators
Year
Types of HVDC transmission systems
Total
Point-to-point
EHV
Point-to-point
UHV
Back-to-back
Number of
systems
2016
14
6
3
23
2017
15
7
3
35
Rated
transmission
capacity (MW)
2016
37,964
39,600
4860
2017
41,164
47,600
4860
93,624
Energy
availability rate
(%)
2016
96.003
93.112
96.971
94.671
2017
95.808
94.885
96.030
95.350
Number of forced
outages
2016
20
14.5
6
40.5
2017
19
11
3
33
Unavailability
rate of forced
energy (%)
2016
0.061
0.167
0.749
0.152
2017
0.172
0.208
0.015
0.182
Unavailability
rate of planned
energy (%)
2016
3.936
6.723
2.287
5.178
2017
4.022
4.908
3.955
4.469
Total electricity
transmitted
(100 mln kWh)
2016
1711.56
1913.23
297.48
3922.27
2017
1891.86
2240.89
330.16
4462.90
Energy utilization
(%)
2016
51.32
55.00
69.68
54.17
2017
52.46
53.74
77.55
54.42
Note In Table 4.9, reliability evaluation indicators such as energy availability rate, unavailability
rate pf forced energy, unavailability rate of planned energy, and energy utilization are calculated by
weighting each system based on rated transmission capacity
with IPRs—was put into trial operation. This is the first of its kind in China, showcasing major breakthroughs in the localization of long-distance, large-capacity and
low-loss UHV core technologies and equipment, which was crucial for optimizing
resource and energy allocation, and ensuring national energy security and reliable
power supply (Tang et al. 2016).
As of 2019, China’s UHV AC transmission projects already in operation and
under construction include:
• 1000 kV Southeast Shanxi-Nanyang-Jingmen UHV AC pilot demonstration
project (2009), with a conversion capacity of 18 million kW;
• 1000 kV Huainan-North Zhejiang-Shanghai UHV AC demonstration project
(2013), with a conversion capacity of 21 million kW;
• 1000 kV North Zhejiang-Fuzhou UHV AC project (2014), with a conversion
capacity of 18 million kW;
Z. Lu and G. Zhu
Table 4.9 Reliability comparison of nationwide HVDC transmission systems in 2016 and 2017
Reliability
indicators
Year
Types of HVDC transmission systems
Total
Point-to-point
EHV
Point-to-point
UHV
Back-to-back
Number of
systems
2016
14
6
3
23
2017
15
7
3
35
Rated
transmission
capacity (MW)
2016
37,964
39,600
4860
2017
41,164
47,600
4860
93,624
Energy
availability rate
(%)
2016
96.003
93.112
96.971
94.671
2017
95.808
94.885
96.030
95.350
Number of forced
outages
2016
20
14.5
6
40.5
2017
19
11
3
33
Unavailability
rate of forced
energy (%)
2016
0.061
0.167
0.749
0.152
2017
0.172
0.208
0.015
0.182
Unavailability
rate of planned
energy (%)
2016
3.936
6.723
2.287
5.178
2017
4.022
4.908
3.955
4.469
Total electricity
transmitted
(100 mln kWh)
2016
1711.56
1913.23
297.48
3922.27
2017
1891.86
2240.89
330.16
4462.90
Energy utilization
(%)
2016
51.32
55.00
69.68
54.17
2017
52.46
53.74
77.55
54.42
Note In Table 4.9, reliability evaluation indicators such as energy availability rate, unavailability
rate pf forced energy, unavailability rate of planned energy, and energy utilization are calculated by
weighting each system based on rated transmission capacity
with IPRs—was put into trial operation. This is the first of its kind in China, showcasing major breakthroughs in the localization of long-distance, large-capacity and
low-loss UHV core technologies and equipment, which was crucial for optimizing
resource and energy allocation, and ensuring national energy security and reliable
power supply (Tang et al. 2016).
As of 2019, China’s UHV AC transmission projects already in operation and
under construction include:
• 1000 kV Southeast Shanxi-Nanyang-Jingmen UHV AC pilot demonstration
project (2009), with a conversion capacity of 18 million kW;
• 1000 kV Huainan-North Zhejiang-Shanghai UHV AC demonstration project
(2013), with a conversion capacity of 21 million kW;
• 1000 kV North Zhejiang-Fuzhou UHV AC project (2014), with a conversion
capacity of 18 million kW;