

4 The Transition of China’s Power System
133
Power Investment Monitoring and Early Warning Results issued by the NEA
in 2017 designated regions dealing with significant wind curtailment such as
Inner Mongolia, Heilongjiang, Jilin, Ningxia, Gansu, and Xinjiang (including
the Corps) as red warning zones, which would not be granted approval of the
construction of any new wind power projects without first addressing wind
curtailment. Since 2018, special notices issued for wind and PV power generation projects have spelled out strict prerequisites concerning the capacity of
new projects to guarantee the efficient utilization of the electricity generated.
4.2.5 Projections on the Transition of China’s Power
Generation Mix
According to a 2017 study by the Institute for Contemporary China Studies of
Tsinghua University, China’s per capita GDP is expected to top US$36,632 by 2035
and US$60,847 by 2050 (Hu 2017). The country’s annual electricity consumption per
capita will reach the current Japanese level of roughly 8000 kWh in 2035. Since the
industrial sector accounts for a larger share of the Chinese economy and consumes
more electricity, it is estimated that annual electricity use per capita will top 8000 kWh
by 2035 and 13,000 kWh by 2050, which is close to the current US level. According
to the National Population Development Plan (2016–2030) released by the State
Council, China’s population is expected to peak at 1.45 billion in 2030, and then
drop to 1.365 billion by 2050. Based on these projections, the country’s overall
power demand will reach 11.6 trillion kWh by 2030 and 17.8 trillion kWh by 2050.
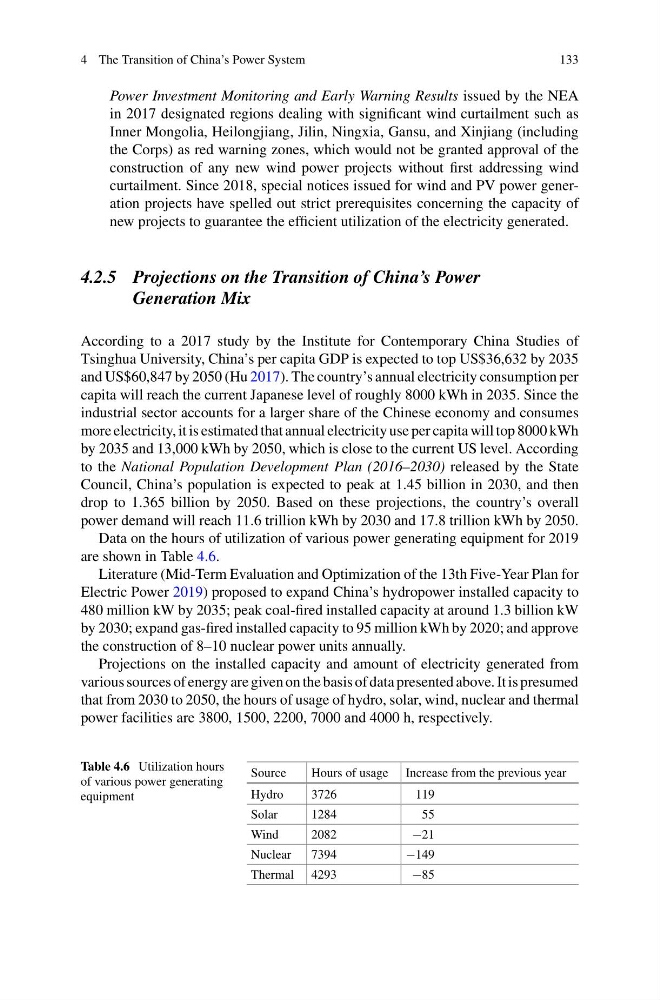
Data on the hours of utilization of various power generating equipment for 2019
are shown in Table 4.6.
Literature (Mid-Term Evaluation and Optimization of the 13th Five-Year Plan for
Electric Power 2019) proposed to expand China’s hydropower installed capacity to
480 million kW by 2035; peak coal-fired installed capacity at around 1.3 billion kW
by 2030; expand gas-fired installed capacity to 95 million kWh by 2020; and approve
the construction of 8–10 nuclear power units annually.
Projections on the installed capacity and amount of electricity generated from
various sources of energy are given on the basis of data presented above. It is presumed
that from 2030 to 2050, the hours of usage of hydro, solar, wind, nuclear and thermal
power facilities are 3800, 1500, 2200, 7000 and 4000 h, respectively.
Table 4.6 Utilization hours
of various power generating
equipment
Source
Hours of usage Increase from the previous year
Hydro
3726
119
Solar
1284
55
Wind
2082
−21
Nuclear
7394
−149
Thermal 4293
−85
133
Power Investment Monitoring and Early Warning Results issued by the NEA
in 2017 designated regions dealing with significant wind curtailment such as
Inner Mongolia, Heilongjiang, Jilin, Ningxia, Gansu, and Xinjiang (including
the Corps) as red warning zones, which would not be granted approval of the
construction of any new wind power projects without first addressing wind
curtailment. Since 2018, special notices issued for wind and PV power generation projects have spelled out strict prerequisites concerning the capacity of
new projects to guarantee the efficient utilization of the electricity generated.
4.2.5 Projections on the Transition of China’s Power
Generation Mix
According to a 2017 study by the Institute for Contemporary China Studies of
Tsinghua University, China’s per capita GDP is expected to top US$36,632 by 2035
and US$60,847 by 2050 (Hu 2017). The country’s annual electricity consumption per
capita will reach the current Japanese level of roughly 8000 kWh in 2035. Since the
industrial sector accounts for a larger share of the Chinese economy and consumes
more electricity, it is estimated that annual electricity use per capita will top 8000 kWh
by 2035 and 13,000 kWh by 2050, which is close to the current US level. According
to the National Population Development Plan (2016–2030) released by the State
Council, China’s population is expected to peak at 1.45 billion in 2030, and then
drop to 1.365 billion by 2050. Based on these projections, the country’s overall
power demand will reach 11.6 trillion kWh by 2030 and 17.8 trillion kWh by 2050.
Data on the hours of utilization of various power generating equipment for 2019
are shown in Table 4.6.
Literature (Mid-Term Evaluation and Optimization of the 13th Five-Year Plan for
Electric Power 2019) proposed to expand China’s hydropower installed capacity to
480 million kW by 2035; peak coal-fired installed capacity at around 1.3 billion kW
by 2030; expand gas-fired installed capacity to 95 million kWh by 2020; and approve
the construction of 8–10 nuclear power units annually.
Projections on the installed capacity and amount of electricity generated from
various sources of energy are given on the basis of data presented above. It is presumed
that from 2030 to 2050, the hours of usage of hydro, solar, wind, nuclear and thermal
power facilities are 3800, 1500, 2200, 7000 and 4000 h, respectively.
Table 4.6 Utilization hours
of various power generating
equipment
Source
Hours of usage Increase from the previous year
Hydro
3726
119
Solar
1284
55
Wind
2082
−21
Nuclear
7394
−149
Thermal 4293
−85