

4 The Transition of China’s Power System
117
4.2.1.1 The Development of Thermal and Hydro Power in China
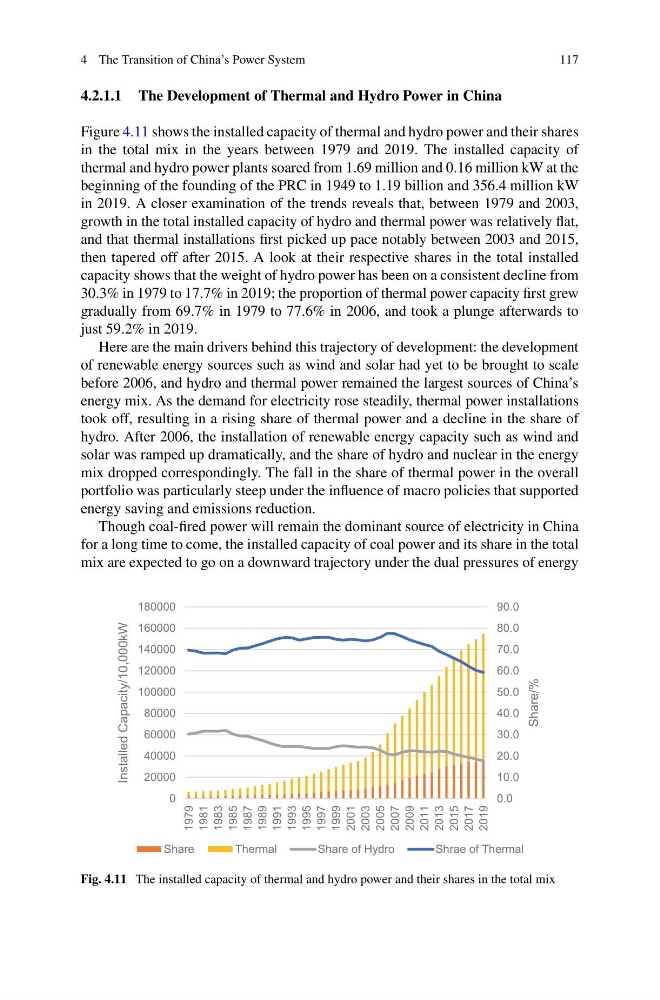
Figure 4.11 shows the installed capacity of thermal and hydro power and their shares
in the total mix in the years between 1979 and 2019. The installed capacity of
thermal and hydro power plants soared from 1.69 million and 0.16 million kW at the
beginning of the founding of the PRC in 1949 to 1.19 billion and 356.4 million kW
in 2019. A closer examination of the trends reveals that, between 1979 and 2003,
growth in the total installed capacity of hydro and thermal power was relatively flat,
and that thermal installations first picked up pace notably between 2003 and 2015,
then tapered off after 2015. A look at their respective shares in the total installed
capacity shows that the weight of hydro power has been on a consistent decline from
30.3% in 1979 to 17.7% in 2019; the proportion of thermal power capacity first grew
gradually from 69.7% in 1979 to 77.6% in 2006, and took a plunge afterwards to
just 59.2% in 2019.
Here are the main drivers behind this trajectory of development: the development
of renewable energy sources such as wind and solar had yet to be brought to scale
before 2006, and hydro and thermal power remained the largest sources of China’s
energy mix. As the demand for electricity rose steadily, thermal power installations
took off, resulting in a rising share of thermal power and a decline in the share of
hydro. After 2006, the installation of renewable energy capacity such as wind and
solar was ramped up dramatically, and the share of hydro and nuclear in the energy
mix dropped correspondingly. The fall in the share of thermal power in the overall
portfolio was particularly steep under the influence of macro policies that supported
energy saving and emissions reduction.
Though coal-fired power will remain the dominant source of electricity in China
for a long time to come, the installed capacity of coal power and its share in the total
mix are expected to go on a downward trajectory under the dual pressures of energy
0.0
10.0
20.0
30.0
40.0
50.0
60.0
70.0
80.0
90.0
0
20000
40000
60000
80000
100000
120000
140000
160000
180000
1979
1981
1983
1985
1987
1989
1991
1993
1995
1997
1999
2001
2003
2005
2007
2009
2011
2013
2015
2017
2019
Share/%
Installed Capacity/10,000kW
Share
Thermal
Share of Hydro
Shrae of Thermal
Fig. 4.11 The installed capacity of thermal and hydro power and their shares in the total mix
117
4.2.1.1 The Development of Thermal and Hydro Power in China
Figure 4.11 shows the installed capacity of thermal and hydro power and their shares
in the total mix in the years between 1979 and 2019. The installed capacity of
thermal and hydro power plants soared from 1.69 million and 0.16 million kW at the
beginning of the founding of the PRC in 1949 to 1.19 billion and 356.4 million kW
in 2019. A closer examination of the trends reveals that, between 1979 and 2003,
growth in the total installed capacity of hydro and thermal power was relatively flat,
and that thermal installations first picked up pace notably between 2003 and 2015,
then tapered off after 2015. A look at their respective shares in the total installed
capacity shows that the weight of hydro power has been on a consistent decline from
30.3% in 1979 to 17.7% in 2019; the proportion of thermal power capacity first grew
gradually from 69.7% in 1979 to 77.6% in 2006, and took a plunge afterwards to
just 59.2% in 2019.
Here are the main drivers behind this trajectory of development: the development
of renewable energy sources such as wind and solar had yet to be brought to scale
before 2006, and hydro and thermal power remained the largest sources of China’s
energy mix. As the demand for electricity rose steadily, thermal power installations
took off, resulting in a rising share of thermal power and a decline in the share of
hydro. After 2006, the installation of renewable energy capacity such as wind and
solar was ramped up dramatically, and the share of hydro and nuclear in the energy
mix dropped correspondingly. The fall in the share of thermal power in the overall
portfolio was particularly steep under the influence of macro policies that supported
energy saving and emissions reduction.
Though coal-fired power will remain the dominant source of electricity in China
for a long time to come, the installed capacity of coal power and its share in the total
mix are expected to go on a downward trajectory under the dual pressures of energy
0.0
10.0
20.0
30.0
40.0
50.0
60.0
70.0
80.0
90.0
0
20000
40000
60000
80000
100000
120000
140000
160000
180000
1979
1981
1983
1985
1987
1989
1991
1993
1995
1997
1999
2001
2003
2005
2007
2009
2011
2013
2015
2017
2019
Share/%
Installed Capacity/10,000kW
Share
Thermal
Share of Hydro
Shrae of Thermal
Fig. 4.11 The installed capacity of thermal and hydro power and their shares in the total mix