

116
Z. Lu and G. Zhu
0%
10%
20%
30%
40%
50%
60%
70%
80%
90%
100%
2009 2010 2011 2012 2013 2014 2015 2016 2017 2018 2019
Hydro
Thermal
Nuclear
Wind
Solar
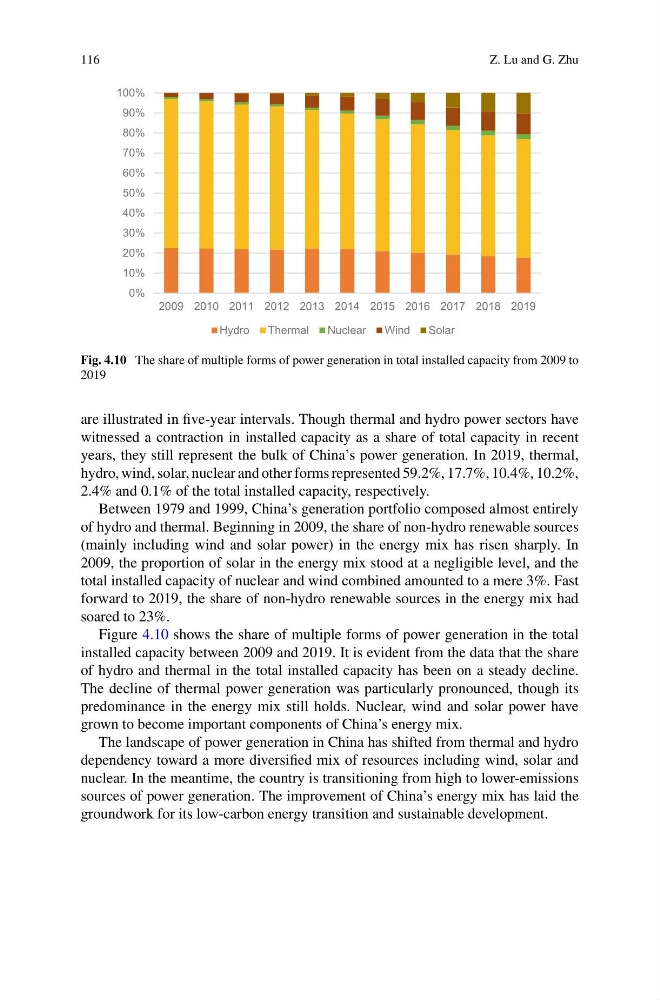
Fig. 4.10 The share of multiple forms of power generation in total installed capacity from 2009 to
2019
are illustrated in five-year intervals. Though thermal and hydro power sectors have
witnessed a contraction in installed capacity as a share of total capacity in recent
years, they still represent the bulk of China’s power generation. In 2019, thermal,
hydro, wind, solar, nuclear and other forms represented 59.2%, 17.7%, 10.4%, 10.2%,
2.4% and 0.1% of the total installed capacity, respectively.
Between 1979 and 1999, China’s generation portfolio composed almost entirely
of hydro and thermal. Beginning in 2009, the share of non-hydro renewable sources
(mainly including wind and solar power) in the energy mix has risen sharply. In
2009, the proportion of solar in the energy mix stood at a negligible level, and the
total installed capacity of nuclear and wind combined amounted to a mere 3%. Fast
forward to 2019, the share of non-hydro renewable sources in the energy mix had
soared to 23%.
Figure 4.10 shows the share of multiple forms of power generation in the total
installed capacity between 2009 and 2019. It is evident from the data that the share
of hydro and thermal in the total installed capacity has been on a steady decline.
The decline of thermal power generation was particularly pronounced, though its
predominance in the energy mix still holds. Nuclear, wind and solar power have
grown to become important components of China’s energy mix.
The landscape of power generation in China has shifted from thermal and hydro
dependency toward a more diversified mix of resources including wind, solar and
nuclear. In the meantime, the country is transitioning from high to lower-emissions
sources of power generation. The improvement of China’s energy mix has laid the
groundwork for its low-carbon energy transition and sustainable development.
Z. Lu and G. Zhu
0%
10%
20%
30%
40%
50%
60%
70%
80%
90%
100%
2009 2010 2011 2012 2013 2014 2015 2016 2017 2018 2019
Hydro
Thermal
Nuclear
Wind
Solar
Fig. 4.10 The share of multiple forms of power generation in total installed capacity from 2009 to
2019
are illustrated in five-year intervals. Though thermal and hydro power sectors have
witnessed a contraction in installed capacity as a share of total capacity in recent
years, they still represent the bulk of China’s power generation. In 2019, thermal,
hydro, wind, solar, nuclear and other forms represented 59.2%, 17.7%, 10.4%, 10.2%,
2.4% and 0.1% of the total installed capacity, respectively.
Between 1979 and 1999, China’s generation portfolio composed almost entirely
of hydro and thermal. Beginning in 2009, the share of non-hydro renewable sources
(mainly including wind and solar power) in the energy mix has risen sharply. In
2009, the proportion of solar in the energy mix stood at a negligible level, and the
total installed capacity of nuclear and wind combined amounted to a mere 3%. Fast
forward to 2019, the share of non-hydro renewable sources in the energy mix had
soared to 23%.
Figure 4.10 shows the share of multiple forms of power generation in the total
installed capacity between 2009 and 2019. It is evident from the data that the share
of hydro and thermal in the total installed capacity has been on a steady decline.
The decline of thermal power generation was particularly pronounced, though its
predominance in the energy mix still holds. Nuclear, wind and solar power have
grown to become important components of China’s energy mix.
The landscape of power generation in China has shifted from thermal and hydro
dependency toward a more diversified mix of resources including wind, solar and
nuclear. In the meantime, the country is transitioning from high to lower-emissions
sources of power generation. The improvement of China’s energy mix has laid the
groundwork for its low-carbon energy transition and sustainable development.