

3 Low-Carbon Transition (Peaking) of Chinese Cities: The Case …
91
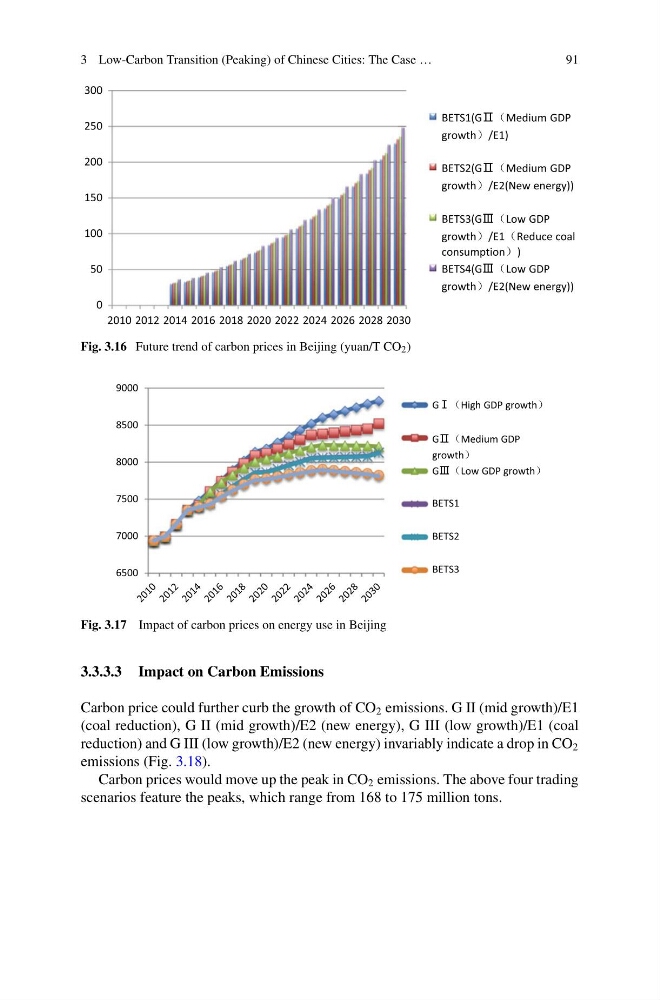
Fig. 3.16 Future trend of carbon prices in Beijing (yuan/T CO 2 )
Fig. 3.17 Impact of carbon prices on energy use in Beijing
3.3.3.3 Impact on Carbon Emissions
Carbon price could further curb the growth of CO 2 emissions. G II (mid growth)/E1
(coal reduction), G II (mid growth)/E2 (new energy), G III (low growth)/E1 (coal
reduction) and G III (low growth)/E2 (new energy) invariably indicate a drop in CO 2
emissions (Fig. 3.18).
Carbon prices would move up the peak in CO 2 emissions. The above four trading
scenarios feature the peaks, which range from 168 to 175 million tons.
91
Fig. 3.16 Future trend of carbon prices in Beijing (yuan/T CO 2 )
Fig. 3.17 Impact of carbon prices on energy use in Beijing
3.3.3.3 Impact on Carbon Emissions
Carbon price could further curb the growth of CO 2 emissions. G II (mid growth)/E1
(coal reduction), G II (mid growth)/E2 (new energy), G III (low growth)/E1 (coal
reduction) and G III (low growth)/E2 (new energy) invariably indicate a drop in CO 2
emissions (Fig. 3.18).
Carbon prices would move up the peak in CO 2 emissions. The above four trading
scenarios feature the peaks, which range from 168 to 175 million tons.