

90
J. Zhou and S. Chang
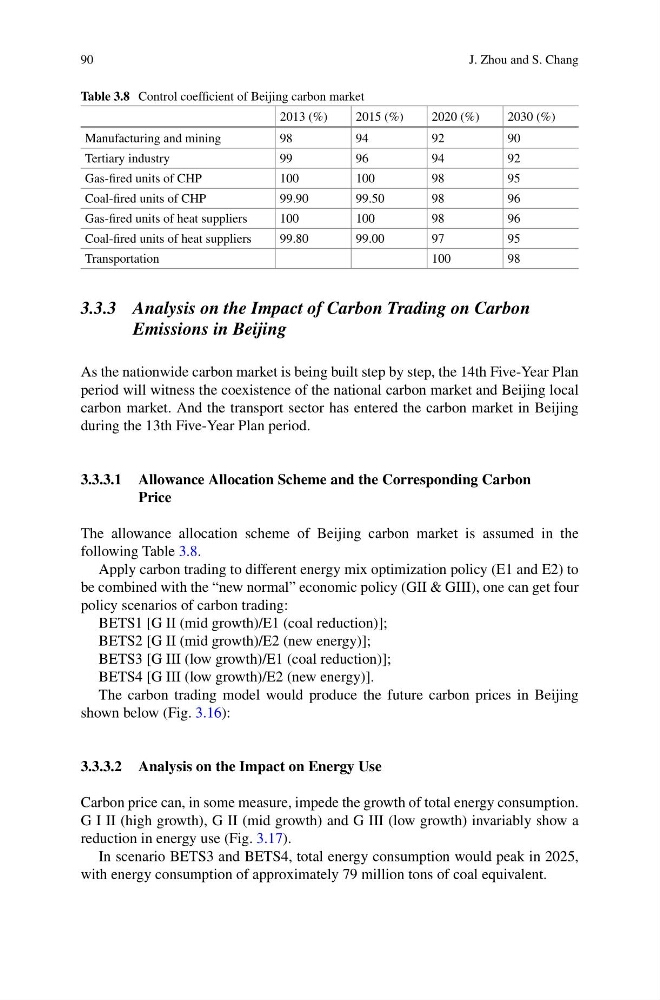
Table 3.8 Control coefficient of Beijing carbon market
2013 (%)
2015 (%)
2020 (%)
2030 (%)
Manufacturing and mining
98
94
92
90
Tertiary industry
99
96
94
92
Gas-fired units of CHP
100
100
98
95
Coal-fired units of CHP
99.90
99.50
98
96
Gas-fired units of heat suppliers
100
100
98
96
Coal-fired units of heat suppliers
99.80
99.00
97
95
Transportation
100
98
3.3.3 Analysis on the Impact of Carbon Trading on Carbon
Emissions in Beijing
As the nationwide carbon market is being built step by step, the 14th Five-Year Plan
period will witness the coexistence of the national carbon market and Beijing local
carbon market. And the transport sector has entered the carbon market in Beijing
during the 13th Five-Year Plan period.
3.3.3.1 Allowance Allocation Scheme and the Corresponding Carbon
Price
The allowance allocation scheme of Beijing carbon market is assumed in the
following Table 3.8.
Apply carbon trading to different energy mix optimization policy (E1 and E2) to
be combined with the “new normal” economic policy (GII & GIII), one can get four
policy scenarios of carbon trading:
BETS1 [G II (mid growth)/E1 (coal reduction)];
BETS2 [G II (mid growth)/E2 (new energy)];
BETS3 [G III (low growth)/E1 (coal reduction)];
BETS4 [G III (low growth)/E2 (new energy)].
The carbon trading model would produce the future carbon prices in Beijing
shown below (Fig. 3.16):
3.3.3.2 Analysis on the Impact on Energy Use
Carbon price can, in some measure, impede the growth of total energy consumption.
G I II (high growth), G II (mid growth) and G III (low growth) invariably show a
reduction in energy use (Fig. 3.17).
In scenario BETS3 and BETS4, total energy consumption would peak in 2025,
with energy consumption of approximately 79 million tons of coal equivalent.
J. Zhou and S. Chang
Table 3.8 Control coefficient of Beijing carbon market
2013 (%)
2015 (%)
2020 (%)
2030 (%)
Manufacturing and mining
98
94
92
90
Tertiary industry
99
96
94
92
Gas-fired units of CHP
100
100
98
95
Coal-fired units of CHP
99.90
99.50
98
96
Gas-fired units of heat suppliers
100
100
98
96
Coal-fired units of heat suppliers
99.80
99.00
97
95
Transportation
100
98
3.3.3 Analysis on the Impact of Carbon Trading on Carbon
Emissions in Beijing
As the nationwide carbon market is being built step by step, the 14th Five-Year Plan
period will witness the coexistence of the national carbon market and Beijing local
carbon market. And the transport sector has entered the carbon market in Beijing
during the 13th Five-Year Plan period.
3.3.3.1 Allowance Allocation Scheme and the Corresponding Carbon
Price
The allowance allocation scheme of Beijing carbon market is assumed in the
following Table 3.8.
Apply carbon trading to different energy mix optimization policy (E1 and E2) to
be combined with the “new normal” economic policy (GII & GIII), one can get four
policy scenarios of carbon trading:
BETS1 [G II (mid growth)/E1 (coal reduction)];
BETS2 [G II (mid growth)/E2 (new energy)];
BETS3 [G III (low growth)/E1 (coal reduction)];
BETS4 [G III (low growth)/E2 (new energy)].
The carbon trading model would produce the future carbon prices in Beijing
shown below (Fig. 3.16):
3.3.3.2 Analysis on the Impact on Energy Use
Carbon price can, in some measure, impede the growth of total energy consumption.
G I II (high growth), G II (mid growth) and G III (low growth) invariably show a
reduction in energy use (Fig. 3.17).
In scenario BETS3 and BETS4, total energy consumption would peak in 2025,
with energy consumption of approximately 79 million tons of coal equivalent.