

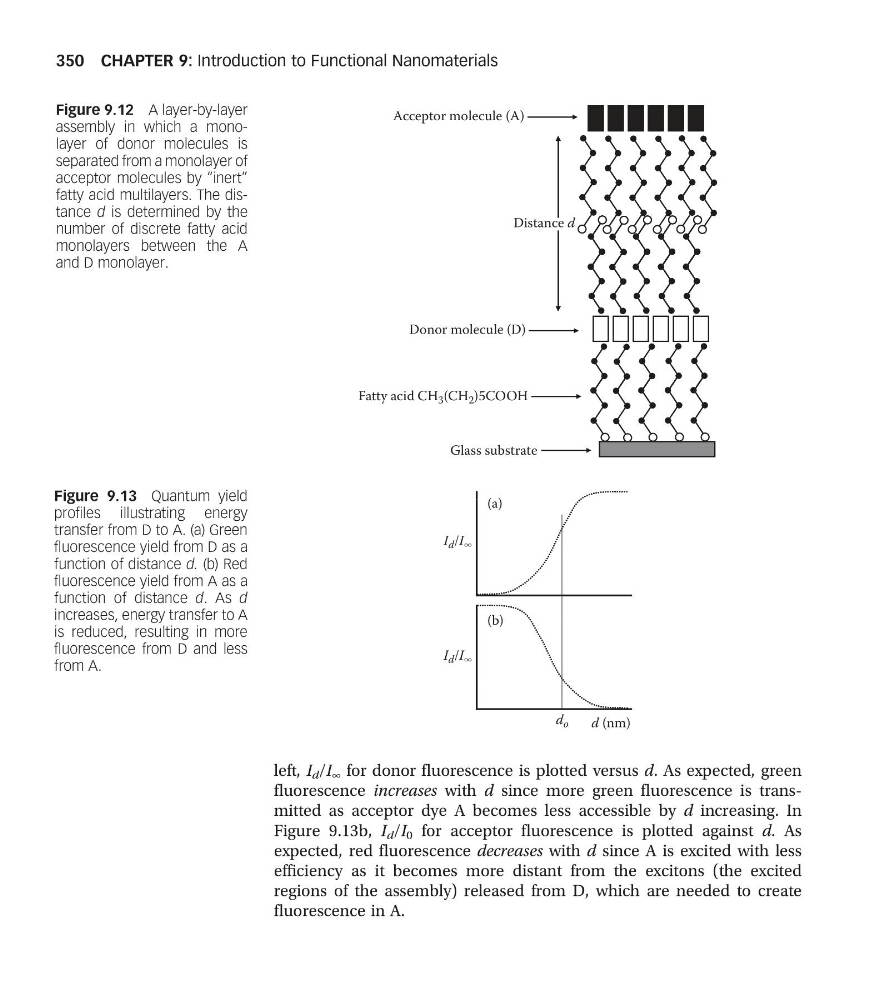
left, I d /I ∞ for donor fluorescence is plotted versus d. As expected, green
fluorescence increases with d since more green fluorescence is transmitted as acceptor dye A becomes less accessible by d increasing. In
Figure 9.13b, I d /I 0 for acceptor fluorescence is plotted against d. As
expected, red fluorescence decreases with d since A is excited with less
efficiency as it becomes more distant from the excitons (the excited
regions of the assembly) released from D, which are needed to create
fluorescence in A.
(a)
(b)
I d /I ∞
I d /I ∞
d (nm)
d o
Figure 9.13 Quantum yield
profiles illustrating energy
transfer from D to A. (a) Green
fluorescence yield from D as a
function of distance d. (b) Red
fluorescence yield from A as a
function of distance d. As d
increases, energy transfer to A
is reduced, resulting in more
fluorescence from D and less
from A.
Acceptor molecule (A)
Donor molecule (D)
Fatty acid CH 3 (CH 2 )5COOH
Glass substrate
Distance d
Figure 9.12 A layer-by-layer
assembly in which a monolayer of donor molecules is
separated from a monolayer of
acceptor molecules by “inert”
fatty acid multilayers. The distance d is determined by the
number of discrete fatty acid
monolayers between the A
and D monolayer.
CHAPTER 9: Introduction to Functional Nanomaterials
350
fluorescence increases with d since more green fluorescence is transmitted as acceptor dye A becomes less accessible by d increasing. In
Figure 9.13b, I d /I 0 for acceptor fluorescence is plotted against d. As
expected, red fluorescence decreases with d since A is excited with less
efficiency as it becomes more distant from the excitons (the excited
regions of the assembly) released from D, which are needed to create
fluorescence in A.
(a)
(b)
I d /I ∞
I d /I ∞
d (nm)
d o
Figure 9.13 Quantum yield
profiles illustrating energy
transfer from D to A. (a) Green
fluorescence yield from D as a
function of distance d. (b) Red
fluorescence yield from A as a
function of distance d. As d
increases, energy transfer to A
is reduced, resulting in more
fluorescence from D and less
from A.
Acceptor molecule (A)
Donor molecule (D)
Fatty acid CH 3 (CH 2 )5COOH
Glass substrate
Distance d
Figure 9.12 A layer-by-layer
assembly in which a monolayer of donor molecules is
separated from a monolayer of
acceptor molecules by “inert”
fatty acid multilayers. The distance d is determined by the
number of discrete fatty acid
monolayers between the A
and D monolayer.
CHAPTER 9: Introduction to Functional Nanomaterials
350