

corresponds to a change of 0.1°. For common analytes such as proteins,
the correlation between Δq spr and the amount of substance adsorbed to
the surface has been determined and a 1000-RU shift is approximately
equivalent to an adsorption of 0.1 ng/mm
2 for most proteins.
It should be noted from Equation 8.24 that the SPR angle is a function of
both the thickness d and the index of refraction n of the thin film,
meaning that neither parameter can be extracted by itself without making
certain assumptions (i.e., a change in thickness could be extracted if it
were assumed that the refractive index remained constant). For this
reason, the change in SPR angle is said to measure the effective refractive
index or a thickness- and refractive index-related parameter analogous to
the y and Δ parameters measured by an ellipsometer. In order to resolve
thickness and absolute refractive index simultaneously, another method
must be used, such as dual polarization interferometry or spectroscopic
ellipsometry.
8.4.2.2 SPR instrument setup
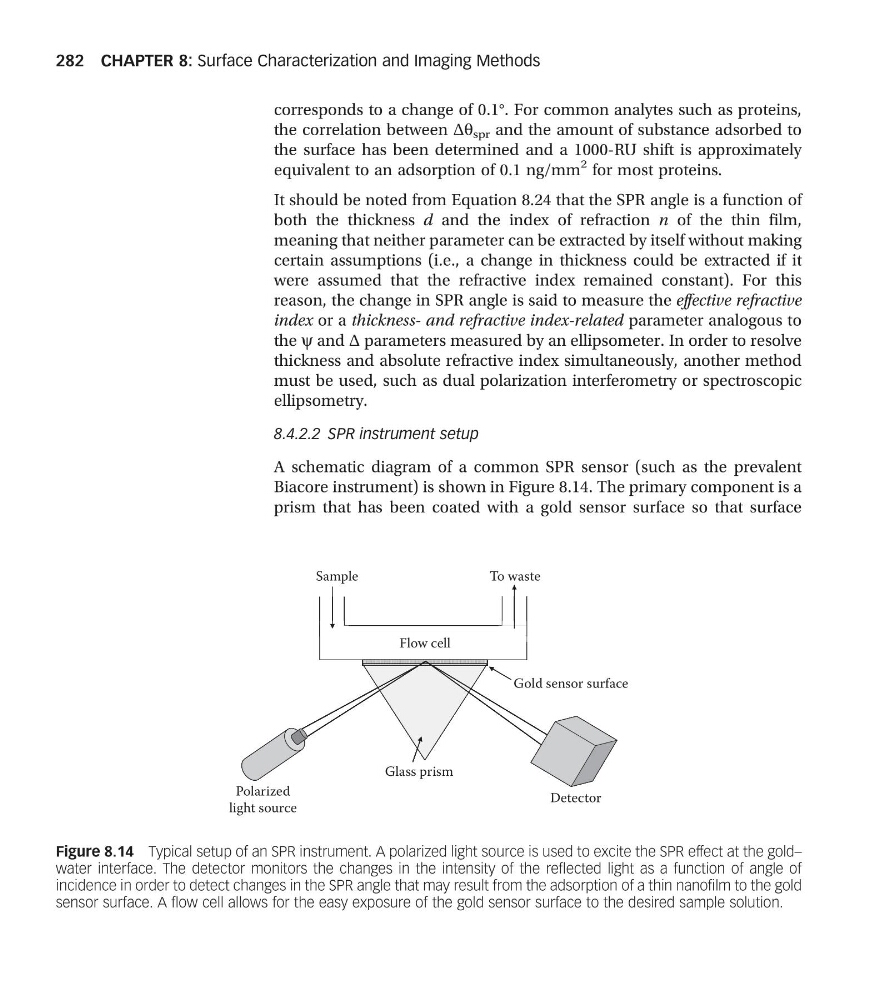
A schematic diagram of a common SPR sensor (such as the prevalent
Biacore instrument) is shown in Figure 8.14. The primary component is a
prism that has been coated with a gold sensor surface so that surface
To waste
Sample
Flow cell
Gold sensor surface
Polarized
light source
Glass prism
Detector
Figure 8.14 Typical setup of an SPR instrument. A polarized light source is used to excite the SPR effect at the gold–
water interface. The detector monitors the changes in the intensity of the reflected light as a function of angle of
incidence in order to detect changes in the SPR angle that may result from the adsorption of a thin nanofilm to the gold
sensor surface. A flow cell allows for the easy exposure of the gold sensor surface to the desired sample solution.
CHAPTER 8: Surface Characterization and Imaging Methods
282
the correlation between Δq spr and the amount of substance adsorbed to
the surface has been determined and a 1000-RU shift is approximately
equivalent to an adsorption of 0.1 ng/mm
2 for most proteins.
It should be noted from Equation 8.24 that the SPR angle is a function of
both the thickness d and the index of refraction n of the thin film,
meaning that neither parameter can be extracted by itself without making
certain assumptions (i.e., a change in thickness could be extracted if it
were assumed that the refractive index remained constant). For this
reason, the change in SPR angle is said to measure the effective refractive
index or a thickness- and refractive index-related parameter analogous to
the y and Δ parameters measured by an ellipsometer. In order to resolve
thickness and absolute refractive index simultaneously, another method
must be used, such as dual polarization interferometry or spectroscopic
ellipsometry.
8.4.2.2 SPR instrument setup
A schematic diagram of a common SPR sensor (such as the prevalent
Biacore instrument) is shown in Figure 8.14. The primary component is a
prism that has been coated with a gold sensor surface so that surface
To waste
Sample
Flow cell
Gold sensor surface
Polarized
light source
Glass prism
Detector
Figure 8.14 Typical setup of an SPR instrument. A polarized light source is used to excite the SPR effect at the gold–
water interface. The detector monitors the changes in the intensity of the reflected light as a function of angle of
incidence in order to detect changes in the SPR angle that may result from the adsorption of a thin nanofilm to the gold
sensor surface. A flow cell allows for the easy exposure of the gold sensor surface to the desired sample solution.
CHAPTER 8: Surface Characterization and Imaging Methods
282