

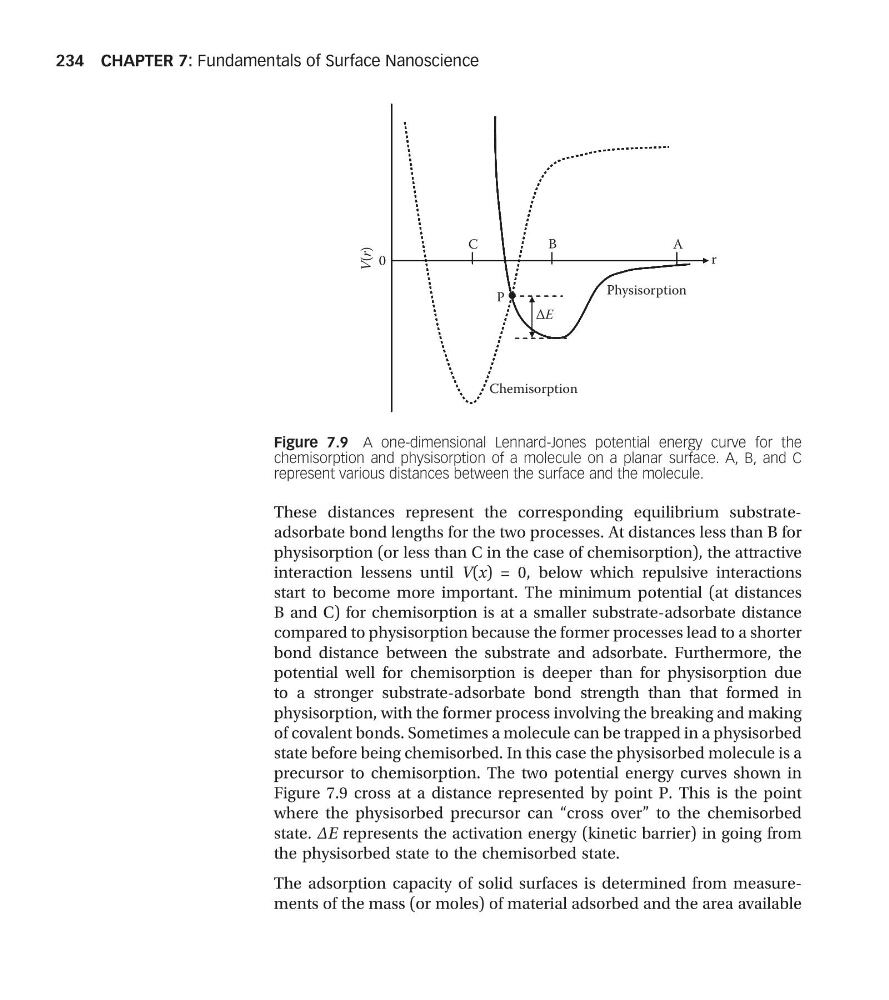
These distances represent the corresponding equilibrium substrateadsorbate bond lengths for the two processes. At distances less than B for
physisorption (or less than C in the case of chemisorption), the attractive
interaction lessens until V(x) = 0, below which repulsive interactions
start to become more important. The minimum potential (at distances
B and C) for chemisorption is at a smaller substrate-adsorbate distance
compared to physisorption because the former processes lead to a shorter
bond distance between the substrate and adsorbate. Furthermore, the
potential well for chemisorption is deeper than for physisorption due
to a stronger substrate-adsorbate bond strength than that formed in
physisorption, with the former process involving the breaking and making
of covalent bonds. Sometimes a molecule can be trapped in a physisorbed
state before being chemisorbed. In this case the physisorbed molecule is a
precursor to chemisorption. The two potential energy curves shown in
Figure 7.9 cross at a distance represented by point P. This is the point
where the physisorbed precursor can “cross over” to the chemisorbed
state. ΔE represents the activation energy (kinetic barrier) in going from
the physisorbed state to the chemisorbed state.
The adsorption capacity of solid surfaces is determined from measurements of the mass (or moles) of material adsorbed and the area available
A
B
C
0
V(r)
r
ΔE
P
Physisorption
Chemisorption
Figure 7.9 A one-dimensional Lennard-Jones potential energy curve for the
chemisorption and physisorption of a molecule on a planar surface. A, B, and C
represent various distances between the surface and the molecule.
CHAPTER 7: Fundamentals of Surface Nanoscience
234
physisorption (or less than C in the case of chemisorption), the attractive
interaction lessens until V(x) = 0, below which repulsive interactions
start to become more important. The minimum potential (at distances
B and C) for chemisorption is at a smaller substrate-adsorbate distance
compared to physisorption because the former processes lead to a shorter
bond distance between the substrate and adsorbate. Furthermore, the
potential well for chemisorption is deeper than for physisorption due
to a stronger substrate-adsorbate bond strength than that formed in
physisorption, with the former process involving the breaking and making
of covalent bonds. Sometimes a molecule can be trapped in a physisorbed
state before being chemisorbed. In this case the physisorbed molecule is a
precursor to chemisorption. The two potential energy curves shown in
Figure 7.9 cross at a distance represented by point P. This is the point
where the physisorbed precursor can “cross over” to the chemisorbed
state. ΔE represents the activation energy (kinetic barrier) in going from
the physisorbed state to the chemisorbed state.
The adsorption capacity of solid surfaces is determined from measurements of the mass (or moles) of material adsorbed and the area available
A
B
C
0
V(r)
r
ΔE
P
Physisorption
Chemisorption
Figure 7.9 A one-dimensional Lennard-Jones potential energy curve for the
chemisorption and physisorption of a molecule on a planar surface. A, B, and C
represent various distances between the surface and the molecule.
CHAPTER 7: Fundamentals of Surface Nanoscience
234