

the quantum mechanical model the most likely position of the electron is
centered at L/2 for the n = 1 energy level. For the n = 2 level we see a single
node centered at L/2, which tells us that the electron cannot ever be at the
center of our one-dimensional box. The number of nodes increases as n
increases; in fact the number of nodes is given by n-1. This is in contrast to
a classical picture in which no nodes exist and the probability of finding
the electron at any point along x is always the same.
Example 4.6 Approaching the Classical Limit
By referring to Figure 4.3, explain how the probability distribution
changes as n increases and the implications of this change on the
behavior of the electron trapped in the one-dimensional box.
Solution At low quantum numbers the probability distribution for
each energy state is uneven in different regions from x = 0 to L. As the
quantum number increases, the distribution gets more and more
even such that at n = ∞ the distribution is even across the entirety
of the box. This is the expected classical result and occurs because
as n approaches ∞, the energy E of the system approaches ∞.
Thus at very large values of n, the likelihood that the electron is
bound decreases and so the effect of quantization diminishes.
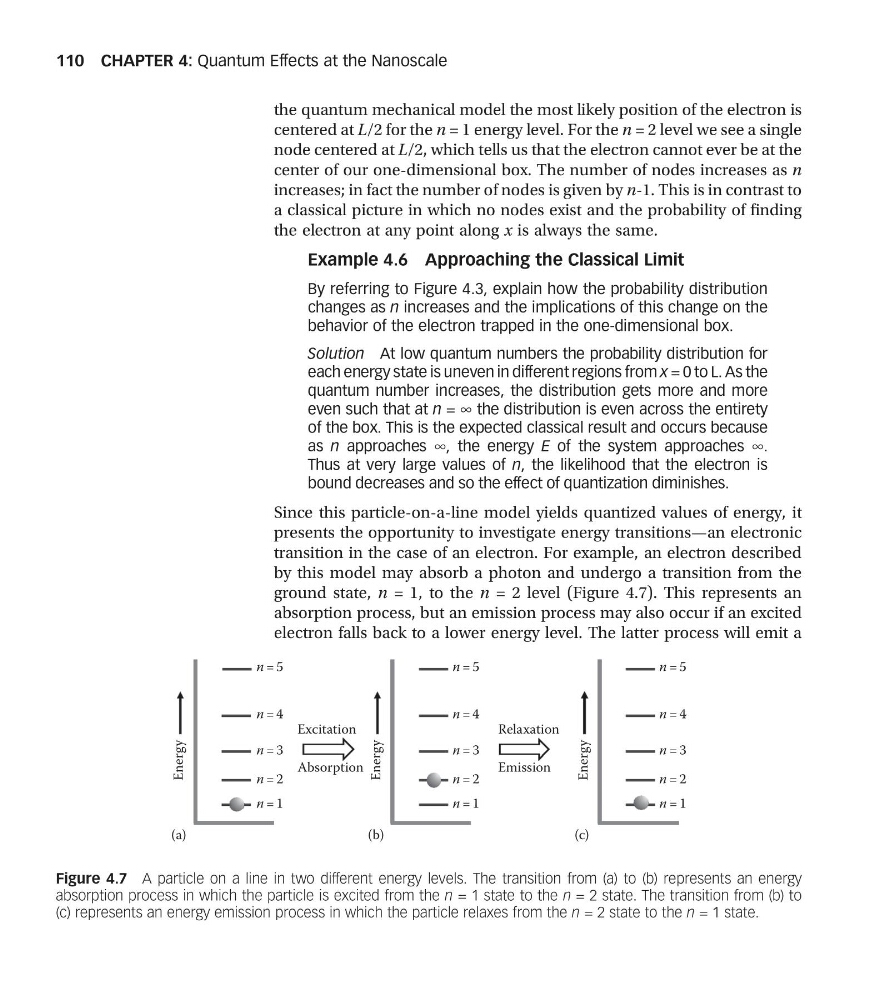
Since this particle-on-a-line model yields quantized values of energy, it
presents the opportunity to investigate energy transitions—an electronic
transition in the case of an electron. For example, an electron described
by this model may absorb a photon and undergo a transition from the
ground state, n = 1, to the n = 2 level (Figure 4.7). This represents an
absorption process, but an emission process may also occur if an excited
electron falls back to a lower energy level. The latter process will emit a
Energy
Energy
Energy
Excitation
Relaxation
Absorption
Emission
(a)
(b)
(c)
n = 5
n = 5
n = 4
n = 3
n = 2
n = 1
n = 4
n = 3
n = 2
n = 1
n = 5
n = 4
n = 3
n = 2
n = 1
Figure 4.7 A particle on a line in two different energy levels. The transition from (a) to (b) represents an energy
absorption process in which the particle is excited from the n = 1 state to the n = 2 state. The transition from (b) to
(c) represents an energy emission process in which the particle relaxes from the n = 2 state to the n = 1 state.
CHAPTER 4: Quantum Effects at the Nanoscale
110
centered at L/2 for the n = 1 energy level. For the n = 2 level we see a single
node centered at L/2, which tells us that the electron cannot ever be at the
center of our one-dimensional box. The number of nodes increases as n
increases; in fact the number of nodes is given by n-1. This is in contrast to
a classical picture in which no nodes exist and the probability of finding
the electron at any point along x is always the same.
Example 4.6 Approaching the Classical Limit
By referring to Figure 4.3, explain how the probability distribution
changes as n increases and the implications of this change on the
behavior of the electron trapped in the one-dimensional box.
Solution At low quantum numbers the probability distribution for
each energy state is uneven in different regions from x = 0 to L. As the
quantum number increases, the distribution gets more and more
even such that at n = ∞ the distribution is even across the entirety
of the box. This is the expected classical result and occurs because
as n approaches ∞, the energy E of the system approaches ∞.
Thus at very large values of n, the likelihood that the electron is
bound decreases and so the effect of quantization diminishes.
Since this particle-on-a-line model yields quantized values of energy, it
presents the opportunity to investigate energy transitions—an electronic
transition in the case of an electron. For example, an electron described
by this model may absorb a photon and undergo a transition from the
ground state, n = 1, to the n = 2 level (Figure 4.7). This represents an
absorption process, but an emission process may also occur if an excited
electron falls back to a lower energy level. The latter process will emit a
Energy
Energy
Energy
Excitation
Relaxation
Absorption
Emission
(a)
(b)
(c)
n = 5
n = 5
n = 4
n = 3
n = 2
n = 1
n = 4
n = 3
n = 2
n = 1
n = 5
n = 4
n = 3
n = 2
n = 1
Figure 4.7 A particle on a line in two different energy levels. The transition from (a) to (b) represents an energy
absorption process in which the particle is excited from the n = 1 state to the n = 2 state. The transition from (b) to
(c) represents an energy emission process in which the particle relaxes from the n = 2 state to the n = 1 state.
CHAPTER 4: Quantum Effects at the Nanoscale
110