

3 PAIRING COAL WITH SOLAR: THE UAE’S FRAGMENTED …
67
7431.3
7362.5
5670
5600
650
316
16
30,079
260
32
0
5,000
10,000
15,000
20,000
25,000
30,000
35,000
Natural Gas
Solar
Coal
Nuclear
Hydro
Biomass
Diesel
Hybrid
MW
UAE installed and planned capacity
2017 capacity
New capacity
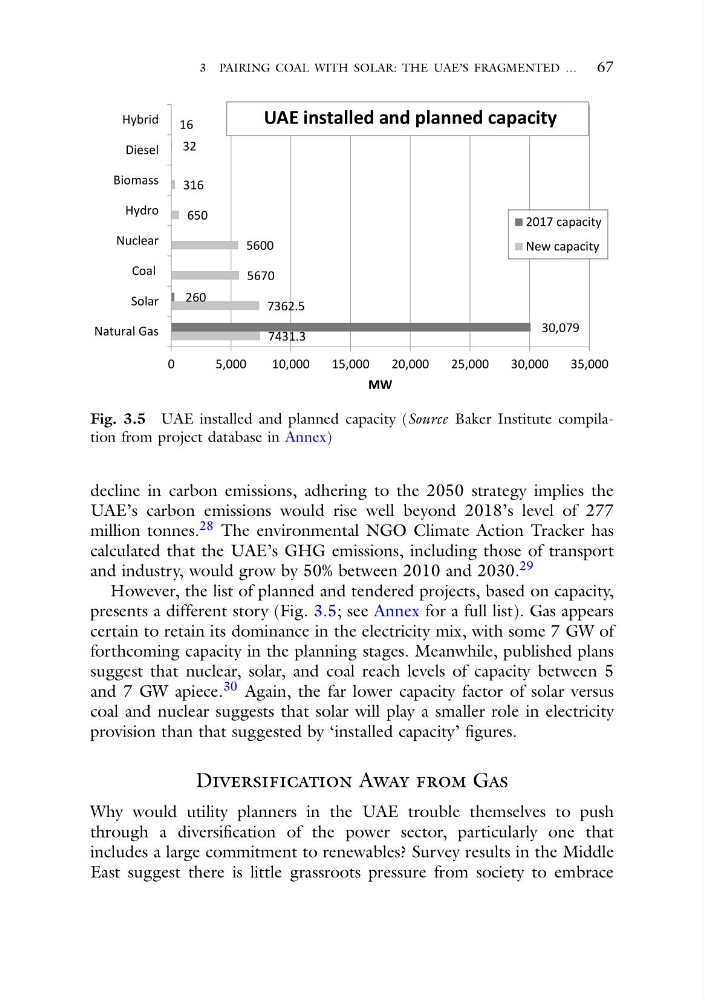
Fig. 3.5 UAE installed and planned capacity (Source Baker Institute compilation from project database in Annex)
decline in carbon emissions, adhering to the 2050 strategy implies the
UAE’s carbon emissions would rise well beyond 2018’s level of 277
million tonnes. 28 The environmental NGO Climate Action Tracker has
calculated that the UAE’s GHG emissions, including those of transport
and industry, would grow by 50% between 2010 and 2030. 29
However, the list of planned and tendered projects, based on capacity,
presents a different story (Fig. 3.5; see Annex for a full list). Gas appears
certain to retain its dominance in the electricity mix, with some 7 GW of
forthcoming capacity in the planning stages. Meanwhile, published plans
suggest that nuclear, solar, and coal reach levels of capacity between 5
and 7 GW apiece. 30 Again, the far lower capacity factor of solar versus
coal and nuclear suggests that solar will play a smaller role in electricity
provision than that suggested by ‘installed capacity’ figures.
Diversification Away from Gas
Why would utility planners in the UAE trouble themselves to push
through a diversification of the power sector, particularly one that
includes a large commitment to renewables? Survey results in the Middle
East suggest there is little grassroots pressure from society to embrace
67
7431.3
7362.5
5670
5600
650
316
16
30,079
260
32
0
5,000
10,000
15,000
20,000
25,000
30,000
35,000
Natural Gas
Solar
Coal
Nuclear
Hydro
Biomass
Diesel
Hybrid
MW
UAE installed and planned capacity
2017 capacity
New capacity
Fig. 3.5 UAE installed and planned capacity (Source Baker Institute compilation from project database in Annex)
decline in carbon emissions, adhering to the 2050 strategy implies the
UAE’s carbon emissions would rise well beyond 2018’s level of 277
million tonnes. 28 The environmental NGO Climate Action Tracker has
calculated that the UAE’s GHG emissions, including those of transport
and industry, would grow by 50% between 2010 and 2030. 29
However, the list of planned and tendered projects, based on capacity,
presents a different story (Fig. 3.5; see Annex for a full list). Gas appears
certain to retain its dominance in the electricity mix, with some 7 GW of
forthcoming capacity in the planning stages. Meanwhile, published plans
suggest that nuclear, solar, and coal reach levels of capacity between 5
and 7 GW apiece. 30 Again, the far lower capacity factor of solar versus
coal and nuclear suggests that solar will play a smaller role in electricity
provision than that suggested by ‘installed capacity’ figures.
Diversification Away from Gas
Why would utility planners in the UAE trouble themselves to push
through a diversification of the power sector, particularly one that
includes a large commitment to renewables? Survey results in the Middle
East suggest there is little grassroots pressure from society to embrace