

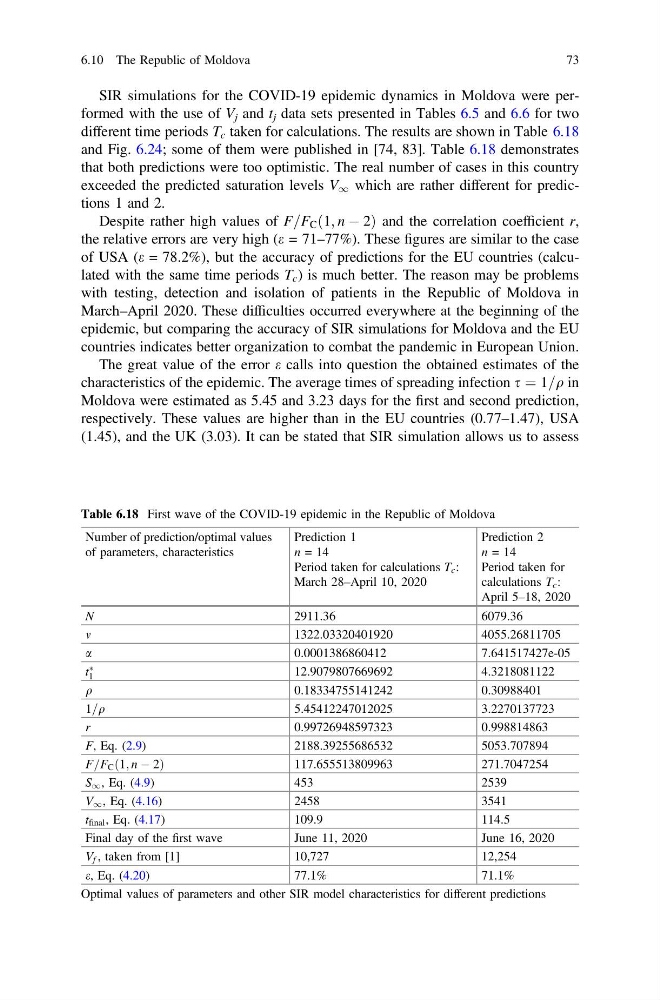
SIR simulations for the COVID-19 epidemic dynamics in Moldova were performed with the use of V j and t j data sets presented in Tables 6.5 and 6.6 for two
different time periods T c taken for calculations. The results are shown in Table 6.18
and Fig. 6.24; some of them were published in [74, 83]. Table 6.18 demonstrates
that both predictions were too optimistic. The real number of cases in this country
exceeded the predicted saturation levels V 1 which are rather different for predictions 1 and 2.
Despite rather high values of F=F C ð1; n À 2Þ and the correlation coefficient r,
the relative errors are very high (e = 71–77%). These figures are similar to the case
of USA (e = 78.2%), but the accuracy of predictions for the EU countries (calculated with the same time periods T c ) is much better. The reason may be problems
with testing, detection and isolation of patients in the Republic of Moldova in
March–April 2020. These difficulties occurred everywhere at the beginning of the
epidemic, but comparing the accuracy of SIR simulations for Moldova and the EU
countries indicates better organization to combat the pandemic in European Union.
The great value of the error e calls into question the obtained estimates of the
characteristics of the epidemic. The average times of spreading infection s ¼ 1=q in
Moldova were estimated as 5.45 and 3.23 days for the first and second prediction,
respectively. These values are higher than in the EU countries (0.77–1.47), USA
(1.45), and the UK (3.03). It can be stated that SIR simulation allows us to assess
Table 6.18 First wave of the COVID-19 epidemic in the Republic of Moldova
Number of prediction/optimal values
of parameters, characteristics
Prediction 1
n = 14
Period taken for calculations T c :
March 28–April 10, 2020
Prediction 2
n = 14
Period taken for
calculations T c :
April 5–18, 2020
N
2911.36
6079.36
m
1322.03320401920
4055.26811705
a
0.0001386860412
7.641517427e-05
t
Ã
1
12.9079807669692
4.3218081122
q
0.18334755141242
0.30988401
1=q
5.45412247012025
3.2270137723
r
0.99726948597323
0.998814863
F, Eq. (2.9)
2188.39255686532
5053.707894
F=F C ð1; n À 2Þ
117.655513809963
271.7047254
S 1 , Eq. (4.9)
453
2539
V 1 , Eq. (4.16)
2458
3541
t final , Eq. (4.17)
109.9
114.5
Final day of the first wave
June 11, 2020
June 16, 2020
V f , taken from [1]
10,727
12,254
e, Eq. (4.20)
77.1%
71.1%
Optimal values of parameters and other SIR model characteristics for different predictions
6.10 The Republic of Moldova
73
different time periods T c taken for calculations. The results are shown in Table 6.18
and Fig. 6.24; some of them were published in [74, 83]. Table 6.18 demonstrates
that both predictions were too optimistic. The real number of cases in this country
exceeded the predicted saturation levels V 1 which are rather different for predictions 1 and 2.
Despite rather high values of F=F C ð1; n À 2Þ and the correlation coefficient r,
the relative errors are very high (e = 71–77%). These figures are similar to the case
of USA (e = 78.2%), but the accuracy of predictions for the EU countries (calculated with the same time periods T c ) is much better. The reason may be problems
with testing, detection and isolation of patients in the Republic of Moldova in
March–April 2020. These difficulties occurred everywhere at the beginning of the
epidemic, but comparing the accuracy of SIR simulations for Moldova and the EU
countries indicates better organization to combat the pandemic in European Union.
The great value of the error e calls into question the obtained estimates of the
characteristics of the epidemic. The average times of spreading infection s ¼ 1=q in
Moldova were estimated as 5.45 and 3.23 days for the first and second prediction,
respectively. These values are higher than in the EU countries (0.77–1.47), USA
(1.45), and the UK (3.03). It can be stated that SIR simulation allows us to assess
Table 6.18 First wave of the COVID-19 epidemic in the Republic of Moldova
Number of prediction/optimal values
of parameters, characteristics
Prediction 1
n = 14
Period taken for calculations T c :
March 28–April 10, 2020
Prediction 2
n = 14
Period taken for
calculations T c :
April 5–18, 2020
N
2911.36
6079.36
m
1322.03320401920
4055.26811705
a
0.0001386860412
7.641517427e-05
t
Ã
1
12.9079807669692
4.3218081122
q
0.18334755141242
0.30988401
1=q
5.45412247012025
3.2270137723
r
0.99726948597323
0.998814863
F, Eq. (2.9)
2188.39255686532
5053.707894
F=F C ð1; n À 2Þ
117.655513809963
271.7047254
S 1 , Eq. (4.9)
453
2539
V 1 , Eq. (4.16)
2458
3541
t final , Eq. (4.17)
109.9
114.5
Final day of the first wave
June 11, 2020
June 16, 2020
V f , taken from [1]
10,727
12,254
e, Eq. (4.20)
77.1%
71.1%
Optimal values of parameters and other SIR model characteristics for different predictions
6.10 The Republic of Moldova
73