

prediction for South Korea. The SIR curves corresponding prediction 3 (with the
highest value of F=F C ð1; n À 2Þ = 981.01748) are shown in Fig. 6.13.
Despite the highest value of the F=F C ð1; n À 2Þ ratio, the number of cases
registered at the beginning of the epidemic V j (“triangles” in Fig. 6.13) is not less
than the theoretical curve V calculated using later data (“circles” in Fig. 6.13), and
some of them even exceed the theoretical estimation. This result casts doubt on the
adequacy of prediction 3, as the experience of calculating the dynamics of the
COVID-19 pandemic in many countries shows that a large number of patients
remain undetected at the beginning of epidemics (see, e.g., Sects. 6.1–6.3).
Prediction 6 does not have such a shortcoming. Its characteristics are shown in
Table 6.12, and the corresponding curves are presented in Fig. 6.14.
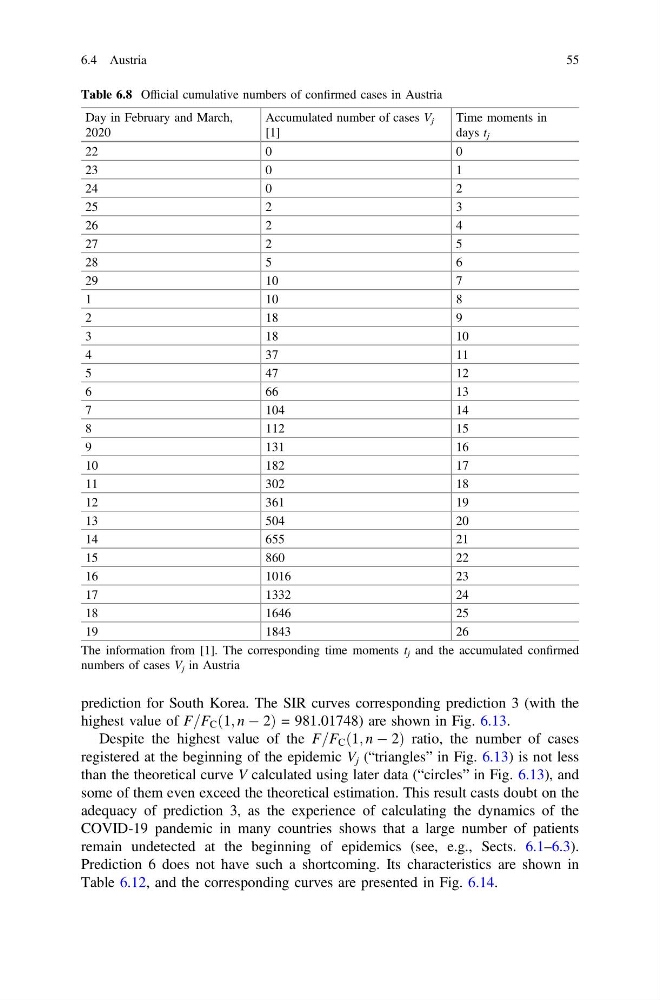
Table 6.8 Official cumulative numbers of confirmed cases in Austria
Day in February and March,
2020
Accumulated number of cases V j
[1]
Time moments in
days t j
22
0
0
23
0
1
24
0
2
25
2
3
26
2
4
27
2
5
28
5
6
29
10
7
1
1 0
8
2
1 8
9
3
1 8
1 0
4
3 7
1 1
5
4 7
1 2
6
6 6
1 3
7
104
14
8
112
15
9
131
16
10
182
17
11
302
18
12
361
19
13
504
20
14
655
21
15
860
22
16
1016
23
17
1332
24
18
1646
25
19
1843
26
The information from [1]. The corresponding time moments t j and the accumulated confirmed
numbers of cases V j in Austria
6.4 Austria
55
highest value of F=F C ð1; n À 2Þ = 981.01748) are shown in Fig. 6.13.
Despite the highest value of the F=F C ð1; n À 2Þ ratio, the number of cases
registered at the beginning of the epidemic V j (“triangles” in Fig. 6.13) is not less
than the theoretical curve V calculated using later data (“circles” in Fig. 6.13), and
some of them even exceed the theoretical estimation. This result casts doubt on the
adequacy of prediction 3, as the experience of calculating the dynamics of the
COVID-19 pandemic in many countries shows that a large number of patients
remain undetected at the beginning of epidemics (see, e.g., Sects. 6.1–6.3).
Prediction 6 does not have such a shortcoming. Its characteristics are shown in
Table 6.12, and the corresponding curves are presented in Fig. 6.14.
Table 6.8 Official cumulative numbers of confirmed cases in Austria
Day in February and March,
2020
Accumulated number of cases V j
[1]
Time moments in
days t j
22
0
0
23
0
1
24
0
2
25
2
3
26
2
4
27
2
5
28
5
6
29
10
7
1
1 0
8
2
1 8
9
3
1 8
1 0
4
3 7
1 1
5
4 7
1 2
6
6 6
1 3
7
104
14
8
112
15
9
131
16
10
182
17
11
302
18
12
361
19
13
504
20
14
655
21
15
860
22
16
1016
23
17
1332
24
18
1646
25
19
1843
26
The information from [1]. The corresponding time moments t j and the accumulated confirmed
numbers of cases V j in Austria
6.4 Austria
55