

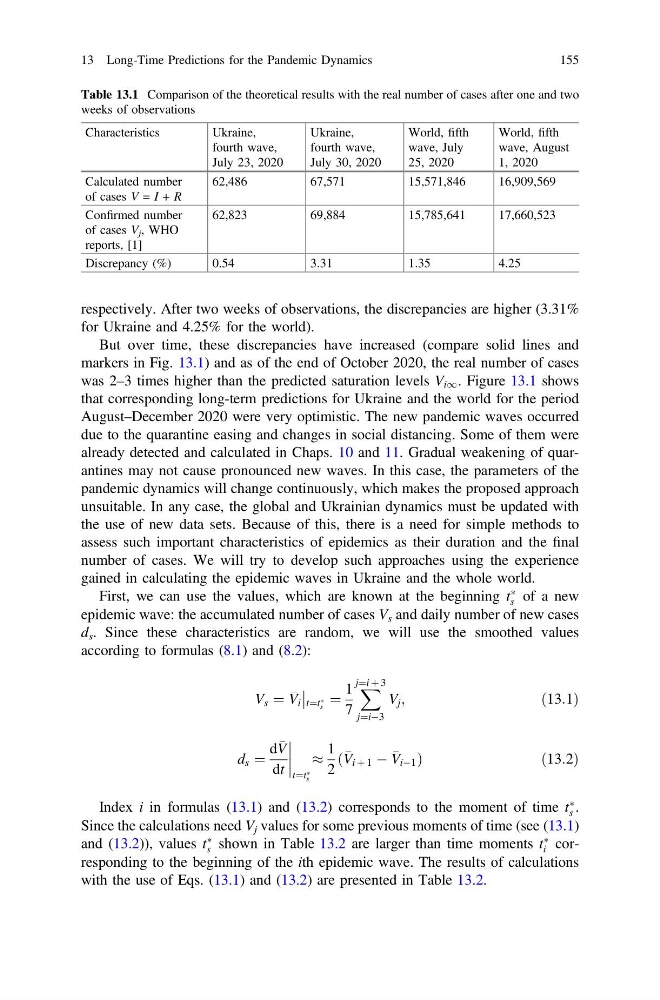
respectively. After two weeks of observations, the discrepancies are higher (3.31%
for Ukraine and 4.25% for the world).
But over time, these discrepancies have increased (compare solid lines and
markers in Fig. 13.1) and as of the end of October 2020, the real number of cases
was 2–3 times higher than the predicted saturation levels V i1 . Figure 13.1 shows
that corresponding long-term predictions for Ukraine and the world for the period
August–December 2020 were very optimistic. The new pandemic waves occurred
due to the quarantine easing and changes in social distancing. Some of them were
already detected and calculated in Chaps. 10 and 11. Gradual weakening of quarantines may not cause pronounced new waves. In this case, the parameters of the
pandemic dynamics will change continuously, which makes the proposed approach
unsuitable. In any case, the global and Ukrainian dynamics must be updated with
the use of new data sets. Because of this, there is a need for simple methods to
assess such important characteristics of epidemics as their duration and the final
number of cases. We will try to develop such approaches using the experience
gained in calculating the epidemic waves in Ukraine and the whole world.
First, we can use the values, which are known at the beginning t
Ã
s of a new
epidemic wave: the accumulated number of cases V s and daily number of new cases
d s . Since these characteristics are random, we will use the smoothed values
according to formulas (8.1) and (8.2):
V s ¼
V i t¼t Ã
s
¼
1
7
X
j¼i þ 3
j¼iÀ3
V j ;
ð13:1Þ
d s ¼
d
V
dt
t¼t Ã
s
%
1
2
V i þ 1 À
V iÀ1
ð
Þ
ð 13:2Þ
Index i in formulas (13.1) and (13.2) corresponds to the moment of time t
Ã
s .
Since the calculations need V j values for some previous moments of time (see (13.1)
and (13.2)), values t
Ã
s shown in Table 13.2 are larger than time moments t
Ã
i corresponding to the beginning of the ith epidemic wave. The results of calculations
with the use of Eqs. (13.1) and (13.2) are presented in Table 13.2.
Table 13.1 Comparison of the theoretical results with the real number of cases after one and two
weeks of observations
Characteristics
Ukraine,
fourth wave,
July 23, 2020
Ukraine,
fourth wave,
July 30, 2020
World, fifth
wave, July
25, 2020
World, fifth
wave, August
1, 2020
Calculated number
of cases V = I + R
62,486
67,571
15,571,846
16,909,569
Confirmed number
of cases V j , WHO
reports, [1]
62,823
69,884
15,785,641
17,660,523
Discrepancy (%)
0.54
3.31
1.35
4.25
13 Long-Time Predictions for the Pandemic Dynamics
155
for Ukraine and 4.25% for the world).
But over time, these discrepancies have increased (compare solid lines and
markers in Fig. 13.1) and as of the end of October 2020, the real number of cases
was 2–3 times higher than the predicted saturation levels V i1 . Figure 13.1 shows
that corresponding long-term predictions for Ukraine and the world for the period
August–December 2020 were very optimistic. The new pandemic waves occurred
due to the quarantine easing and changes in social distancing. Some of them were
already detected and calculated in Chaps. 10 and 11. Gradual weakening of quarantines may not cause pronounced new waves. In this case, the parameters of the
pandemic dynamics will change continuously, which makes the proposed approach
unsuitable. In any case, the global and Ukrainian dynamics must be updated with
the use of new data sets. Because of this, there is a need for simple methods to
assess such important characteristics of epidemics as their duration and the final
number of cases. We will try to develop such approaches using the experience
gained in calculating the epidemic waves in Ukraine and the whole world.
First, we can use the values, which are known at the beginning t
Ã
s of a new
epidemic wave: the accumulated number of cases V s and daily number of new cases
d s . Since these characteristics are random, we will use the smoothed values
according to formulas (8.1) and (8.2):
V s ¼
V i t¼t Ã
s
¼
1
7
X
j¼i þ 3
j¼iÀ3
V j ;
ð13:1Þ
d s ¼
d
V
dt
t¼t Ã
s
%
1
2
V i þ 1 À
V iÀ1
ð
Þ
ð 13:2Þ
Index i in formulas (13.1) and (13.2) corresponds to the moment of time t
Ã
s .
Since the calculations need V j values for some previous moments of time (see (13.1)
and (13.2)), values t
Ã
s shown in Table 13.2 are larger than time moments t
Ã
i corresponding to the beginning of the ith epidemic wave. The results of calculations
with the use of Eqs. (13.1) and (13.2) are presented in Table 13.2.
Table 13.1 Comparison of the theoretical results with the real number of cases after one and two
weeks of observations
Characteristics
Ukraine,
fourth wave,
July 23, 2020
Ukraine,
fourth wave,
July 30, 2020
World, fifth
wave, July
25, 2020
World, fifth
wave, August
1, 2020
Calculated number
of cases V = I + R
62,486
67,571
15,571,846
16,909,569
Confirmed number
of cases V j , WHO
reports, [1]
62,823
69,884
15,785,641
17,660,523
Discrepancy (%)
0.54
3.31
1.35
4.25
13 Long-Time Predictions for the Pandemic Dynamics
155