

Relatively small number of people who spread COVID-19 infection can cause a
fairly long course of the epidemic. In particular, 20 such persons in Ukraine
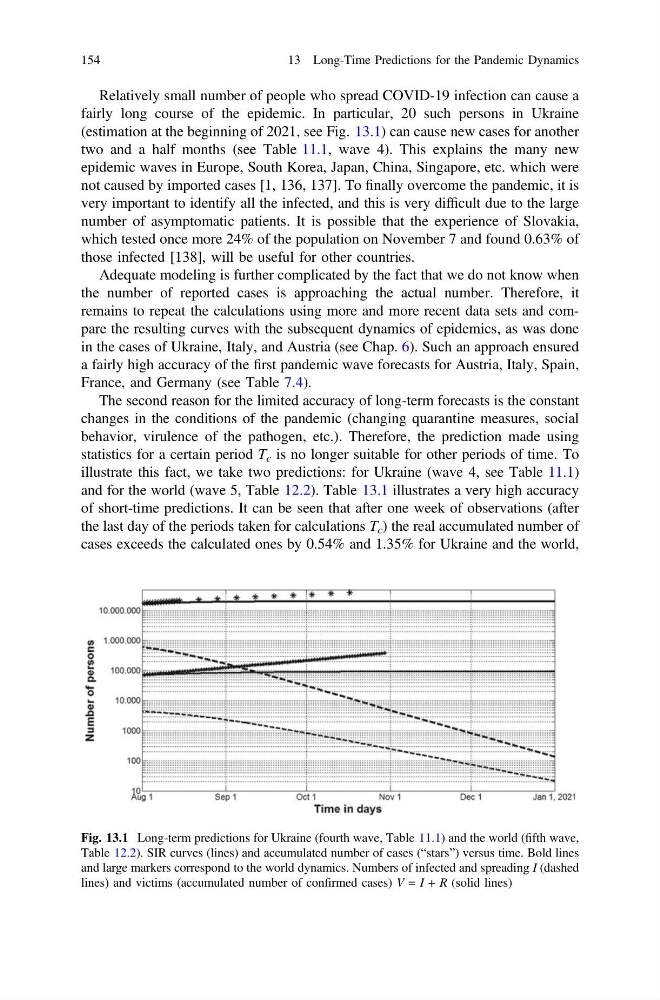
(estimation at the beginning of 2021, see Fig. 13.1) can cause new cases for another
two and a half months (see Table 11.1, wave 4). This explains the many new
epidemic waves in Europe, South Korea, Japan, China, Singapore, etc. which were
not caused by imported cases [1, 136, 137]. To finally overcome the pandemic, it is
very important to identify all the infected, and this is very difficult due to the large
number of asymptomatic patients. It is possible that the experience of Slovakia,
which tested once more 24% of the population on November 7 and found 0.63% of
those infected [138], will be useful for other countries.
Adequate modeling is further complicated by the fact that we do not know when
the number of reported cases is approaching the actual number. Therefore, it
remains to repeat the calculations using more and more recent data sets and compare the resulting curves with the subsequent dynamics of epidemics, as was done
in the cases of Ukraine, Italy, and Austria (see Chap. 6). Such an approach ensured
a fairly high accuracy of the first pandemic wave forecasts for Austria, Italy, Spain,
France, and Germany (see Table 7.4).
The second reason for the limited accuracy of long-term forecasts is the constant
changes in the conditions of the pandemic (changing quarantine measures, social
behavior, virulence of the pathogen, etc.). Therefore, the prediction made using
statistics for a certain period T c is no longer suitable for other periods of time. To
illustrate this fact, we take two predictions: for Ukraine (wave 4, see Table 11.1)
and for the world (wave 5, Table 12.2). Table 13.1 illustrates a very high accuracy
of short-time predictions. It can be seen that after one week of observations (after
the last day of the periods taken for calculations T c ) the real accumulated number of
cases exceeds the calculated ones by 0.54% and 1.35% for Ukraine and the world,
Fig. 13.1 Long-term predictions for Ukraine (fourth wave, Table 11.1) and the world (fifth wave,
Table 12.2). SIR curves (lines) and accumulated number of cases (“stars”) versus time. Bold lines
and large markers correspond to the world dynamics. Numbers of infected and spreading I (dashed
lines) and victims (accumulated number of confirmed cases) V = I + R (solid lines)
154
13 Long-Time Predictions for the Pandemic Dynamics
fairly long course of the epidemic. In particular, 20 such persons in Ukraine
(estimation at the beginning of 2021, see Fig. 13.1) can cause new cases for another
two and a half months (see Table 11.1, wave 4). This explains the many new
epidemic waves in Europe, South Korea, Japan, China, Singapore, etc. which were
not caused by imported cases [1, 136, 137]. To finally overcome the pandemic, it is
very important to identify all the infected, and this is very difficult due to the large
number of asymptomatic patients. It is possible that the experience of Slovakia,
which tested once more 24% of the population on November 7 and found 0.63% of
those infected [138], will be useful for other countries.
Adequate modeling is further complicated by the fact that we do not know when
the number of reported cases is approaching the actual number. Therefore, it
remains to repeat the calculations using more and more recent data sets and compare the resulting curves with the subsequent dynamics of epidemics, as was done
in the cases of Ukraine, Italy, and Austria (see Chap. 6). Such an approach ensured
a fairly high accuracy of the first pandemic wave forecasts for Austria, Italy, Spain,
France, and Germany (see Table 7.4).
The second reason for the limited accuracy of long-term forecasts is the constant
changes in the conditions of the pandemic (changing quarantine measures, social
behavior, virulence of the pathogen, etc.). Therefore, the prediction made using
statistics for a certain period T c is no longer suitable for other periods of time. To
illustrate this fact, we take two predictions: for Ukraine (wave 4, see Table 11.1)
and for the world (wave 5, Table 12.2). Table 13.1 illustrates a very high accuracy
of short-time predictions. It can be seen that after one week of observations (after
the last day of the periods taken for calculations T c ) the real accumulated number of
cases exceeds the calculated ones by 0.54% and 1.35% for Ukraine and the world,
Fig. 13.1 Long-term predictions for Ukraine (fourth wave, Table 11.1) and the world (fifth wave,
Table 12.2). SIR curves (lines) and accumulated number of cases (“stars”) versus time. Bold lines
and large markers correspond to the world dynamics. Numbers of infected and spreading I (dashed
lines) and victims (accumulated number of confirmed cases) V = I + R (solid lines)
154
13 Long-Time Predictions for the Pandemic Dynamics