

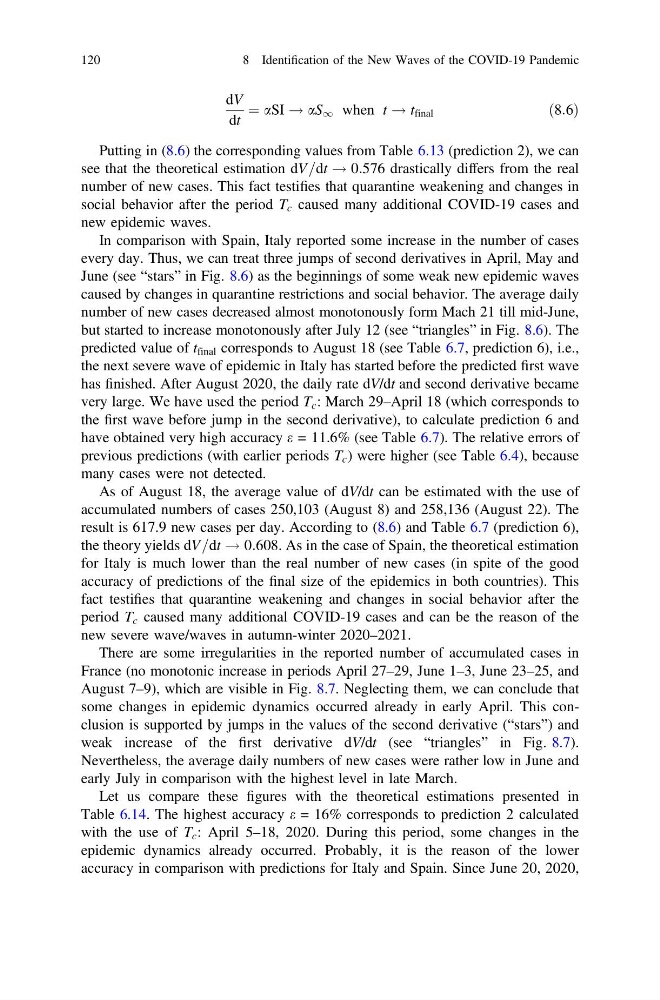
dV
dt
¼ aSI ! aS 1 when t ! t final
ð8:6Þ
Putting in (8.6) the corresponding values from Table 6.13 (prediction 2), we can
see that the theoretical estimation dV=dt ! 0:576 drastically differs from the real
number of new cases. This fact testifies that quarantine weakening and changes in
social behavior after the period T c caused many additional COVID-19 cases and
new epidemic waves.
In comparison with Spain, Italy reported some increase in the number of cases
every day. Thus, we can treat three jumps of second derivatives in April, May and
June (see “stars” in Fig. 8.6) as the beginnings of some weak new epidemic waves
caused by changes in quarantine restrictions and social behavior. The average daily
number of new cases decreased almost monotonously form Mach 21 till mid-June,
but started to increase monotonously after July 12 (see “triangles” in Fig. 8.6). The
predicted value of t final corresponds to August 18 (see Table 6.7, prediction 6), i.e.,
the next severe wave of epidemic in Italy has started before the predicted first wave
has finished. After August 2020, the daily rate dV/dt and second derivative became
very large. We have used the period T c : March 29–April 18 (which corresponds to
the first wave before jump in the second derivative), to calculate prediction 6 and
have obtained very high accuracy e = 11.6% (see Table 6.7). The relative errors of
previous predictions (with earlier periods T c ) were higher (see Table 6.4), because
many cases were not detected.
As of August 18, the average value of dV/dt can be estimated with the use of
accumulated numbers of cases 250,103 (August 8) and 258,136 (August 22). The
result is 617.9 new cases per day. According to (8.6) and Table 6.7 (prediction 6),
the theory yields dV=dt ! 0:608. As in the case of Spain, the theoretical estimation
for Italy is much lower than the real number of new cases (in spite of the good
accuracy of predictions of the final size of the epidemics in both countries). This
fact testifies that quarantine weakening and changes in social behavior after the
period T c caused many additional COVID-19 cases and can be the reason of the
new severe wave/waves in autumn-winter 2020–2021.
There are some irregularities in the reported number of accumulated cases in
France (no monotonic increase in periods April 27–29, June 1–3, June 23–25, and
August 7–9), which are visible in Fig. 8.7. Neglecting them, we can conclude that
some changes in epidemic dynamics occurred already in early April. This conclusion is supported by jumps in the values of the second derivative (“stars”) and
weak increase of the first derivative dV/dt (see “triangles” in Fig. 8.7).
Nevertheless, the average daily numbers of new cases were rather low in June and
early July in comparison with the highest level in late March.
Let us compare these figures with the theoretical estimations presented in
Table 6.14. The highest accuracy e = 16% corresponds to prediction 2 calculated
with the use of T c : April 5–18, 2020. During this period, some changes in the
epidemic dynamics already occurred. Probably, it is the reason of the lower
accuracy in comparison with predictions for Italy and Spain. Since June 20, 2020,
120
8 Identification of the New Waves of the COVID-19 Pandemic
dt
¼ aSI ! aS 1 when t ! t final
ð8:6Þ
Putting in (8.6) the corresponding values from Table 6.13 (prediction 2), we can
see that the theoretical estimation dV=dt ! 0:576 drastically differs from the real
number of new cases. This fact testifies that quarantine weakening and changes in
social behavior after the period T c caused many additional COVID-19 cases and
new epidemic waves.
In comparison with Spain, Italy reported some increase in the number of cases
every day. Thus, we can treat three jumps of second derivatives in April, May and
June (see “stars” in Fig. 8.6) as the beginnings of some weak new epidemic waves
caused by changes in quarantine restrictions and social behavior. The average daily
number of new cases decreased almost monotonously form Mach 21 till mid-June,
but started to increase monotonously after July 12 (see “triangles” in Fig. 8.6). The
predicted value of t final corresponds to August 18 (see Table 6.7, prediction 6), i.e.,
the next severe wave of epidemic in Italy has started before the predicted first wave
has finished. After August 2020, the daily rate dV/dt and second derivative became
very large. We have used the period T c : March 29–April 18 (which corresponds to
the first wave before jump in the second derivative), to calculate prediction 6 and
have obtained very high accuracy e = 11.6% (see Table 6.7). The relative errors of
previous predictions (with earlier periods T c ) were higher (see Table 6.4), because
many cases were not detected.
As of August 18, the average value of dV/dt can be estimated with the use of
accumulated numbers of cases 250,103 (August 8) and 258,136 (August 22). The
result is 617.9 new cases per day. According to (8.6) and Table 6.7 (prediction 6),
the theory yields dV=dt ! 0:608. As in the case of Spain, the theoretical estimation
for Italy is much lower than the real number of new cases (in spite of the good
accuracy of predictions of the final size of the epidemics in both countries). This
fact testifies that quarantine weakening and changes in social behavior after the
period T c caused many additional COVID-19 cases and can be the reason of the
new severe wave/waves in autumn-winter 2020–2021.
There are some irregularities in the reported number of accumulated cases in
France (no monotonic increase in periods April 27–29, June 1–3, June 23–25, and
August 7–9), which are visible in Fig. 8.7. Neglecting them, we can conclude that
some changes in epidemic dynamics occurred already in early April. This conclusion is supported by jumps in the values of the second derivative (“stars”) and
weak increase of the first derivative dV/dt (see “triangles” in Fig. 8.7).
Nevertheless, the average daily numbers of new cases were rather low in June and
early July in comparison with the highest level in late March.
Let us compare these figures with the theoretical estimations presented in
Table 6.14. The highest accuracy e = 16% corresponds to prediction 2 calculated
with the use of T c : April 5–18, 2020. During this period, some changes in the
epidemic dynamics already occurred. Probably, it is the reason of the lower
accuracy in comparison with predictions for Italy and Spain. Since June 20, 2020,
120
8 Identification of the New Waves of the COVID-19 Pandemic