

13 A Critical Intertemporal Analysis of Uganda’s Fiscal Regime …
415
-500.0
-
500.0
1,000.0
1,500.0
2,000.0
2,500.0
-7.0 -5.0 -3.0 -1.0 1.0 3.0 5.0 7.0 9.0 11.0 13.0 15.0 17.0 19.0 21.0 23.0 25.0
$ mm
Years
Buliisa Project - Government Revenue Profile at $60/bbl
EA1 2004 - DROP
EA3A 2004 - DROP
EA1A 2012 -DROP
Theoretical R-factor
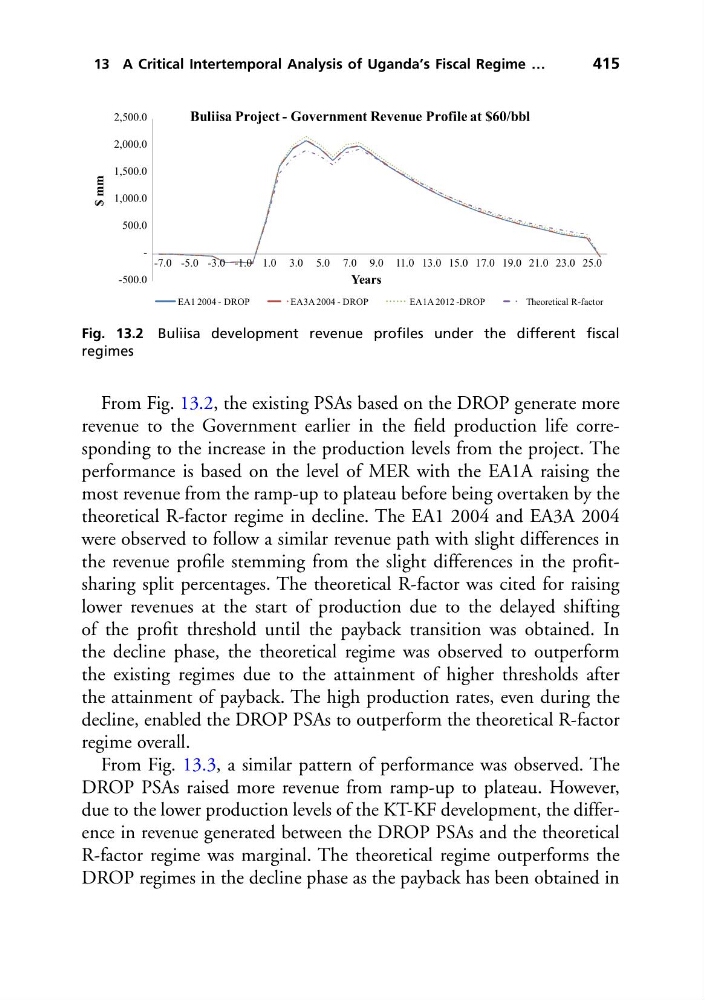
Fig. 13.2 Buliisa development revenue profiles under the different fiscal
regimes
From Fig. 13.2, the existing PSAs based on the DROP generate more
revenue to the Government earlier in the field production life corresponding to the increase in the production levels from the project. The
performance is based on the level of MER with the EA1A raising the
most revenue from the ramp-up to plateau before being overtaken by the
theoretical R-factor regime in decline. The EA1 2004 and EA3A 2004
were observed to follow a similar revenue path with slight differences in
the revenue profile stemming from the slight differences in the profitsharing split percentages. The theoretical R-factor was cited for raising
lower revenues at the start of production due to the delayed shifting
of the profit threshold until the payback transition was obtained. In
the decline phase, the theoretical regime was observed to outperform
the existing regimes due to the attainment of higher thresholds after
the attainment of payback. The high production rates, even during the
decline, enabled the DROP PSAs to outperform the theoretical R-factor
regime overall.
From Fig. 13.3, a similar pattern of performance was observed. The
DROP PSAs raised more revenue from ramp-up to plateau. However,
due to the lower production levels of the KT-KF development, the difference in revenue generated between the DROP PSAs and the theoretical
R-factor regime was marginal. The theoretical regime outperforms the
DROP regimes in the decline phase as the payback has been obtained in
415
-500.0
-
500.0
1,000.0
1,500.0
2,000.0
2,500.0
-7.0 -5.0 -3.0 -1.0 1.0 3.0 5.0 7.0 9.0 11.0 13.0 15.0 17.0 19.0 21.0 23.0 25.0
$ mm
Years
Buliisa Project - Government Revenue Profile at $60/bbl
EA1 2004 - DROP
EA3A 2004 - DROP
EA1A 2012 -DROP
Theoretical R-factor
Fig. 13.2 Buliisa development revenue profiles under the different fiscal
regimes
From Fig. 13.2, the existing PSAs based on the DROP generate more
revenue to the Government earlier in the field production life corresponding to the increase in the production levels from the project. The
performance is based on the level of MER with the EA1A raising the
most revenue from the ramp-up to plateau before being overtaken by the
theoretical R-factor regime in decline. The EA1 2004 and EA3A 2004
were observed to follow a similar revenue path with slight differences in
the revenue profile stemming from the slight differences in the profitsharing split percentages. The theoretical R-factor was cited for raising
lower revenues at the start of production due to the delayed shifting
of the profit threshold until the payback transition was obtained. In
the decline phase, the theoretical regime was observed to outperform
the existing regimes due to the attainment of higher thresholds after
the attainment of payback. The high production rates, even during the
decline, enabled the DROP PSAs to outperform the theoretical R-factor
regime overall.
From Fig. 13.3, a similar pattern of performance was observed. The
DROP PSAs raised more revenue from ramp-up to plateau. However,
due to the lower production levels of the KT-KF development, the difference in revenue generated between the DROP PSAs and the theoretical
R-factor regime was marginal. The theoretical regime outperforms the
DROP regimes in the decline phase as the payback has been obtained in