

414
A. R. Tom
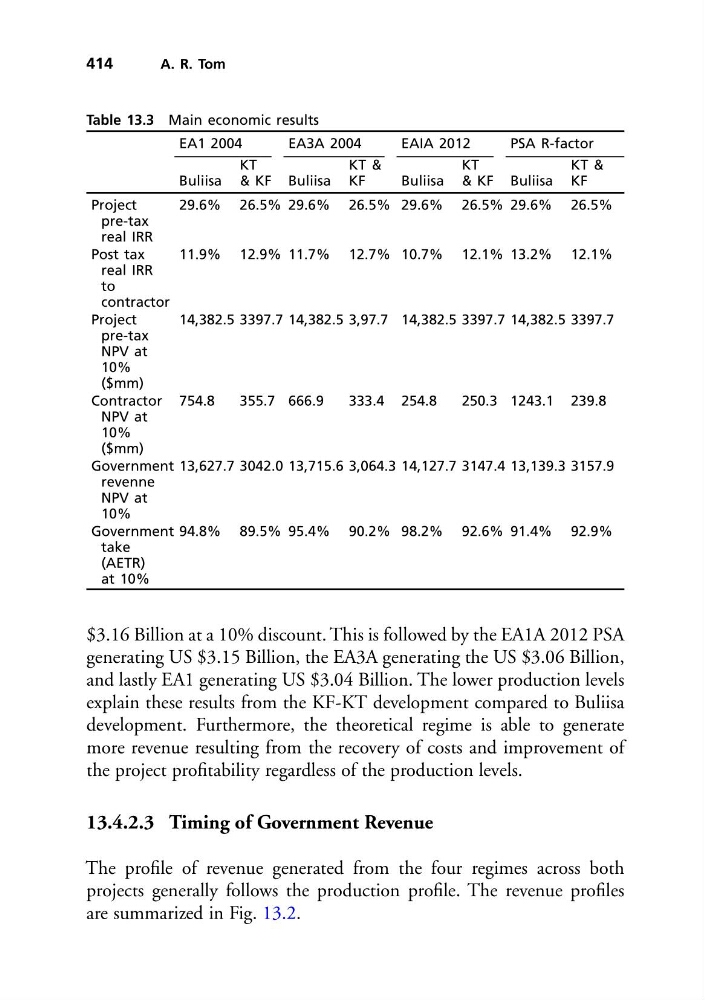
Table 13.3 Main economic results
EA1 2004
EA3A 2004
EAIA 2012
PSA R-factor
Buliisa
KT
& KF Buliisa
KT &
KF
Buliisa
KT
& KF Buliisa
KT &
KF
Project
pre-tax
real IRR
29.6% 26.5% 29.6% 26.5% 29.6% 26.5% 29.6% 26.5%
Post tax
real IRR
to
contractor
11.9% 12.9% 11.7% 12.7% 10.7% 12.1% 13.2% 12.1%
Project
pre-tax
NPV at
10%
($mm)
14,382.5 3397.7 14,382.5 3,97.7 14,382.5 3397.7 14,382.5 3397.7
Contractor
NPV at
10%
($mm)
754.8
355.7 666.9
333.4 254.8
250.3 1243.1 239.8
Government
revenne
NPV at
10%
13,627.7 3042.0 13,715.6 3,064.3 14,127.7 3147.4 13,139.3 3157.9
Government
take
(AETR)
at 10%
94.8% 89.5% 95.4% 90.2% 98.2% 92.6% 91.4% 92.9%
$3.16 Billion at a 10% discount. This is followed by the EA1A 2012 PSA
generating US $3.15 Billion, the EA3A generating the US $3.06 Billion,
and lastly EA1 generating US $3.04 Billion. The lower production levels
explain these results from the KF-KT development compared to Buliisa
development. Furthermore, the theoretical regime is able to generate
more revenue resulting from the recovery of costs and improvement of
the project profitability regardless of the production levels.
13.4.2.3 Timing of Government Revenue
The profile of revenue generated from the four regimes across both
projects generally follows the production profile. The revenue profiles
are summarized in Fig. 13.2.
A. R. Tom
Table 13.3 Main economic results
EA1 2004
EA3A 2004
EAIA 2012
PSA R-factor
Buliisa
KT
& KF Buliisa
KT &
KF
Buliisa
KT
& KF Buliisa
KT &
KF
Project
pre-tax
real IRR
29.6% 26.5% 29.6% 26.5% 29.6% 26.5% 29.6% 26.5%
Post tax
real IRR
to
contractor
11.9% 12.9% 11.7% 12.7% 10.7% 12.1% 13.2% 12.1%
Project
pre-tax
NPV at
10%
($mm)
14,382.5 3397.7 14,382.5 3,97.7 14,382.5 3397.7 14,382.5 3397.7
Contractor
NPV at
10%
($mm)
754.8
355.7 666.9
333.4 254.8
250.3 1243.1 239.8
Government
revenne
NPV at
10%
13,627.7 3042.0 13,715.6 3,064.3 14,127.7 3147.4 13,139.3 3157.9
Government
take
(AETR)
at 10%
94.8% 89.5% 95.4% 90.2% 98.2% 92.6% 91.4% 92.9%
$3.16 Billion at a 10% discount. This is followed by the EA1A 2012 PSA
generating US $3.15 Billion, the EA3A generating the US $3.06 Billion,
and lastly EA1 generating US $3.04 Billion. The lower production levels
explain these results from the KF-KT development compared to Buliisa
development. Furthermore, the theoretical regime is able to generate
more revenue resulting from the recovery of costs and improvement of
the project profitability regardless of the production levels.
13.4.2.3 Timing of Government Revenue
The profile of revenue generated from the four regimes across both
projects generally follows the production profile. The revenue profiles
are summarized in Fig. 13.2.