

5.3 Reversible Flux Motion
89
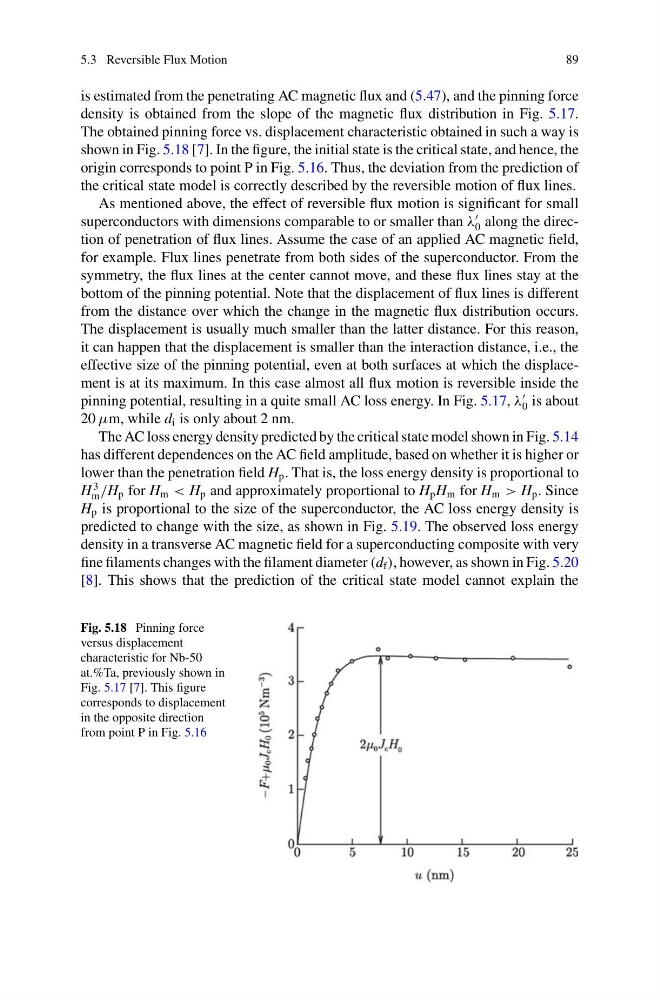
is estimated from the penetrating AC magnetic flux and (5.47), and the pinning force
density is obtained from the slope of the magnetic flux distribution in Fig. 5.17.
The obtained pinning force vs. displacement characteristic obtained in such a way is
shown in Fig. 5.18 [7]. In the figure, the initial state is the critical state, and hence, the
origin corresponds to point P in Fig. 5.16. Thus, the deviation from the prediction of
the critical state model is correctly described by the reversible motion of flux lines.
As mentioned above, the effect of reversible flux motion is significant for small
superconductors with dimensions comparable to or smaller than λ
0 along the direction of penetration of flux lines. Assume the case of an applied AC magnetic field,
for example. Flux lines penetrate from both sides of the superconductor. From the
symmetry, the flux lines at the center cannot move, and these flux lines stay at the
bottom of the pinning potential. Note that the displacement of flux lines is different
from the distance over which the change in the magnetic flux distribution occurs.
The displacement is usually much smaller than the latter distance. For this reason,
it can happen that the displacement is smaller than the interaction distance, i.e., the
effective size of the pinning potential, even at both surfaces at which the displacement is at its maximum. In this case almost all flux motion is reversible inside the
pinning potential, resulting in a quite small AC loss energy. In Fig. 5.17, λ
0 is about
20 μm, while d i is only about 2 nm.
The AC loss energy density predicted by the critical state model shown in Fig. 5.14
has different dependences on the AC field amplitude, based on whether it is higher or
lower than the penetration field H p . That is, the loss energy density is proportional to
H
3
m /H p for H m < H p and approximately proportional to H p H m for H m > H p . Since
H p is proportional to the size of the superconductor, the AC loss energy density is
predicted to change with the size, as shown in Fig. 5.19. The observed loss energy
density in a transverse AC magnetic field for a superconducting composite with very
fine filaments changes with the filament diameter (d f ), however, as shown in Fig. 5.20
[8]. This shows that the prediction of the critical state model cannot explain the
Fig. 5.18 Pinning force
versus displacement
characteristic for Nb-50
at.%Ta, previously shown in
Fig. 5.17 [7]. This figure
corresponds to displacement
in the opposite direction
from point P in Fig. 5.16
89
is estimated from the penetrating AC magnetic flux and (5.47), and the pinning force
density is obtained from the slope of the magnetic flux distribution in Fig. 5.17.
The obtained pinning force vs. displacement characteristic obtained in such a way is
shown in Fig. 5.18 [7]. In the figure, the initial state is the critical state, and hence, the
origin corresponds to point P in Fig. 5.16. Thus, the deviation from the prediction of
the critical state model is correctly described by the reversible motion of flux lines.
As mentioned above, the effect of reversible flux motion is significant for small
superconductors with dimensions comparable to or smaller than λ
0 along the direction of penetration of flux lines. Assume the case of an applied AC magnetic field,
for example. Flux lines penetrate from both sides of the superconductor. From the
symmetry, the flux lines at the center cannot move, and these flux lines stay at the
bottom of the pinning potential. Note that the displacement of flux lines is different
from the distance over which the change in the magnetic flux distribution occurs.
The displacement is usually much smaller than the latter distance. For this reason,
it can happen that the displacement is smaller than the interaction distance, i.e., the
effective size of the pinning potential, even at both surfaces at which the displacement is at its maximum. In this case almost all flux motion is reversible inside the
pinning potential, resulting in a quite small AC loss energy. In Fig. 5.17, λ
0 is about
20 μm, while d i is only about 2 nm.
The AC loss energy density predicted by the critical state model shown in Fig. 5.14
has different dependences on the AC field amplitude, based on whether it is higher or
lower than the penetration field H p . That is, the loss energy density is proportional to
H
3
m /H p for H m < H p and approximately proportional to H p H m for H m > H p . Since
H p is proportional to the size of the superconductor, the AC loss energy density is
predicted to change with the size, as shown in Fig. 5.19. The observed loss energy
density in a transverse AC magnetic field for a superconducting composite with very
fine filaments changes with the filament diameter (d f ), however, as shown in Fig. 5.20
[8]. This shows that the prediction of the critical state model cannot explain the
Fig. 5.18 Pinning force
versus displacement
characteristic for Nb-50
at.%Ta, previously shown in
Fig. 5.17 [7]. This figure
corresponds to displacement
in the opposite direction
from point P in Fig. 5.16