

5.4 Summation Problem and Irreversibility
95
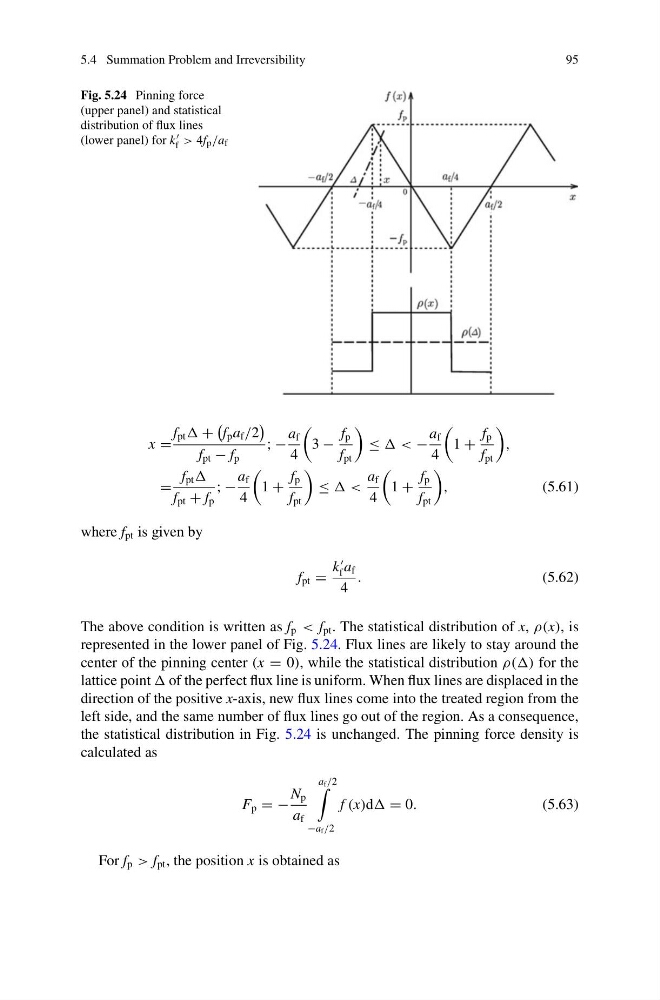
Fig. 5.24 Pinning force
(upper panel) and statistical
distribution of flux lines
(lower panel) for k
f > 4f p /a f
x =
f pt +
f p a f /2
f pt − f p
; −
a f
4
3 −
f p
f pt
≤ < −
a f
4
1 +
f p
f pt
,
=
f pt
f pt + f p
; −
a f
4
1 +
f p
f pt
≤ <
a f
4
1 +
f p
f pt
,
(5.61)
where f pt is given by
f pt =
k
f a f
4
.
(5.62)
The above condition is written as f p < f pt . The statistical distribution of x, ρ(x), is
represented in the lower panel of Fig. 5.24. Flux lines are likely to stay around the
center of the pinning center (x = 0), while the statistical distribution ρ() for the
lattice point of the perfect flux line is uniform. When flux lines are displaced in the
direction of the positive x-axis, new flux lines come into the treated region from the
left side, and the same number of flux lines go out of the region. As a consequence,
the statistical distribution in Fig. 5.24 is unchanged. The pinning force density is
calculated as
F p = −
N p
a f
a f /2
−a f /2
f (x)d = 0.
(5.63)
For f p > f pt , the position x is obtained as
95
Fig. 5.24 Pinning force
(upper panel) and statistical
distribution of flux lines
(lower panel) for k
f > 4f p /a f
x =
f pt +
f p a f /2
f pt − f p
; −
a f
4
3 −
f p
f pt
≤ < −
a f
4
1 +
f p
f pt
,
=
f pt
f pt + f p
; −
a f
4
1 +
f p
f pt
≤ <
a f
4
1 +
f p
f pt
,
(5.61)
where f pt is given by
f pt =
k
f a f
4
.
(5.62)
The above condition is written as f p < f pt . The statistical distribution of x, ρ(x), is
represented in the lower panel of Fig. 5.24. Flux lines are likely to stay around the
center of the pinning center (x = 0), while the statistical distribution ρ() for the
lattice point of the perfect flux line is uniform. When flux lines are displaced in the
direction of the positive x-axis, new flux lines come into the treated region from the
left side, and the same number of flux lines go out of the region. As a consequence,
the statistical distribution in Fig. 5.24 is unchanged. The pinning force density is
calculated as
F p = −
N p
a f
a f /2
−a f /2
f (x)d = 0.
(5.63)
For f p > f pt , the position x is obtained as