

40 4 Gas-Phase Synthesis of Nanoparticles
In most cases, it is nearly impossible to separate the particles from agglomerates. If at all, only soft agglomerates can be separated. High temperatures during
synthesis promote the formation of hard agglomerates. Therefore, after synthesis
and particle formation, it is necessary to reduce the temperature in a quenching
step as fast as possible. This reduces the probability for agglomeration and the
formation of hard agglomerates.
The processes of condensation and coagulation are random ones; this leads to
a relatively broad distribution of particle sizes. Generally, experiments deliver
particle-size distributions with a long tail on the side of the large particles. The
theory of random process says that these size distributions are described by Poisson
distributions. However, as this distribution function is, mathematically, quite
uncomfortable to handle, generally, it is approximated with sufficient precision by
the log-normal distribution. There are possibilities to bias the process of particle
formation, and, therefore, the particle-size distribution, by quenching or charging
the particles electrically.
Box 4.2 Distribution Functions for Particle-Size Distributions
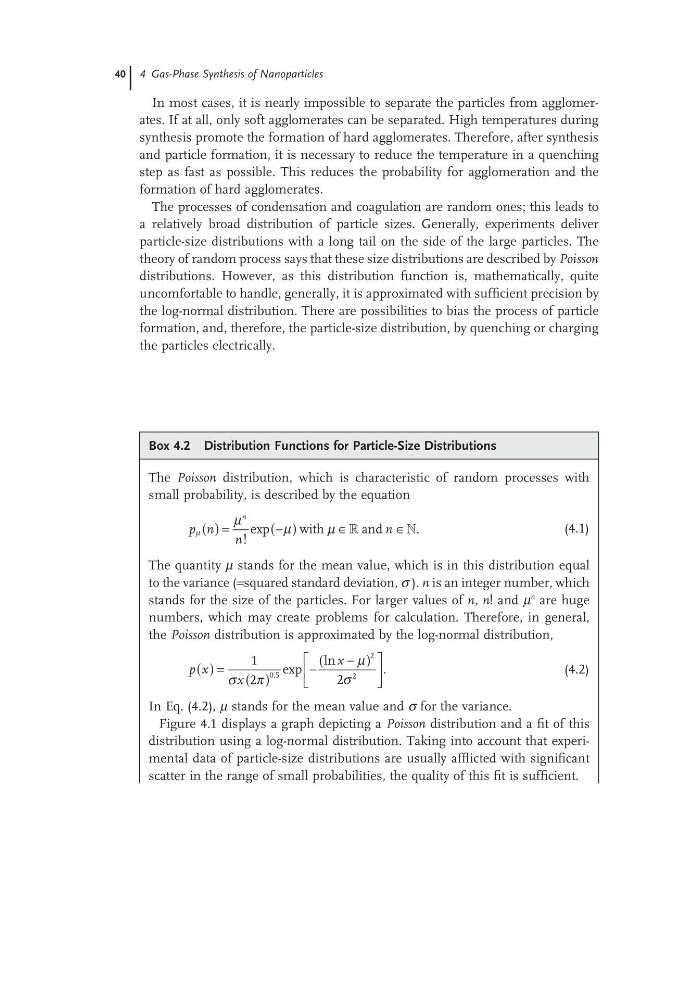
The Poisson distribution, which is characteristic of random processes with
small probability, is described by the equation
p n
n
n
n
µ
µ
µ
µ
( ) =
−
( )
∈
∈
!
exp
.
with
and
»
»
(4.1)
The quantity μ stands for the mean value, which is in this distribution equal
to the variance (=squared standard deviation, σ ). n is an integer number, which
stands for the size of the particles. For larger values of n, n! and μ
n are huge
numbers, which may create problems for calculation. Therefore, in general,
the Poisson distribution is approximated by the log-normal distribution,
p x
x
x
( ) = ( )
−
−
(
)
1
2
2
0 5
2
2
σ π
µ
σ
.
exp
ln
.
(4.2)
In Eq. (4.2), μ stands for the mean value and σ for the variance.
Figure 4.1 displays a graph depicting a Poisson distribution and a fit of this
distribution using a log-normal distribution. Taking into account that experimental data of particle-size distributions are usually afflicted with significant
scatter in the range of small probabilities, the quality of this fit is sufficient.
In most cases, it is nearly impossible to separate the particles from agglomerates. If at all, only soft agglomerates can be separated. High temperatures during
synthesis promote the formation of hard agglomerates. Therefore, after synthesis
and particle formation, it is necessary to reduce the temperature in a quenching
step as fast as possible. This reduces the probability for agglomeration and the
formation of hard agglomerates.
The processes of condensation and coagulation are random ones; this leads to
a relatively broad distribution of particle sizes. Generally, experiments deliver
particle-size distributions with a long tail on the side of the large particles. The
theory of random process says that these size distributions are described by Poisson
distributions. However, as this distribution function is, mathematically, quite
uncomfortable to handle, generally, it is approximated with sufficient precision by
the log-normal distribution. There are possibilities to bias the process of particle
formation, and, therefore, the particle-size distribution, by quenching or charging
the particles electrically.
Box 4.2 Distribution Functions for Particle-Size Distributions
The Poisson distribution, which is characteristic of random processes with
small probability, is described by the equation
p n
n
n
n
µ
µ
µ
µ
( ) =
−
( )
∈
∈
!
exp
.
with
and
»
»
(4.1)
The quantity μ stands for the mean value, which is in this distribution equal
to the variance (=squared standard deviation, σ ). n is an integer number, which
stands for the size of the particles. For larger values of n, n! and μ
n are huge
numbers, which may create problems for calculation. Therefore, in general,
the Poisson distribution is approximated by the log-normal distribution,
p x
x
x
( ) = ( )
−
−
(
)
1
2
2
0 5
2
2
σ π
µ
σ
.
exp
ln
.
(4.2)
In Eq. (4.2), μ stands for the mean value and σ for the variance.
Figure 4.1 displays a graph depicting a Poisson distribution and a fit of this
distribution using a log-normal distribution. Taking into account that experimental data of particle-size distributions are usually afflicted with significant
scatter in the range of small probabilities, the quality of this fit is sufficient.