

2.2 Elementary Consequences of Small Particle Size 19
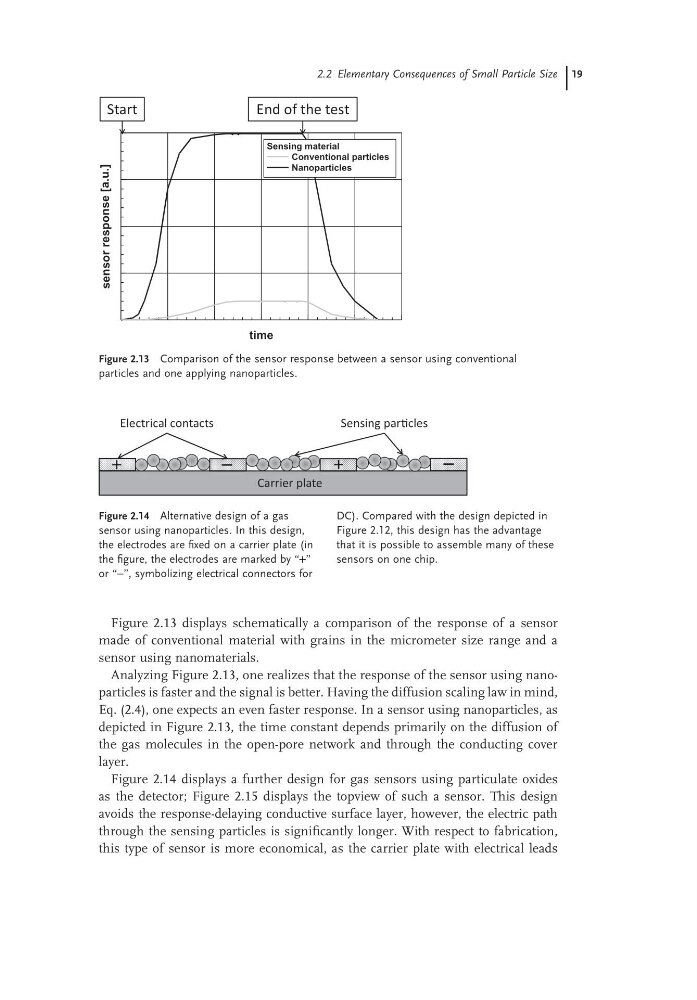
Figure 2.13 Comparison of the sensor response between a sensor using conventional
particles and one applying nanoparticles.
0
2
4
6
8
10
12
time
0
0.25
0.5
0.75
1
sensor
response
[a.u.]
Sensing material
Conventional particles
Nanoparticles
Start
End of the test
Figure 2.13 displays schematically a comparison of the response of a sensor
made of conventional material with grains in the micrometer size range and a
sensor using nanomaterials.
Analyzing Figure 2.13, one realizes that the response of the sensor using nanoparticles is faster and the signal is better. Having the diffusion scaling law in mind,
Eq. (2.4), one expects an even faster response. In a sensor using nanoparticles, as
depicted in Figure 2.13, the time constant depends primarily on the diffusion of
the gas molecules in the open-pore network and through the conducting cover
layer.
Figure 2.14 displays a further design for gas sensors using particulate oxides
as the detector; Figure 2.15 displays the topview of such a sensor. This design
avoids the response-delaying conductive surface layer, however, the electric path
through the sensing particles is significantly longer. With respect to fabrication,
this type of sensor is more economical, as the carrier plate with electrical leads
Figure 2.14 Alternative design of a gas
sensor using nanoparticles. In this design,
the electrodes are fixed on a carrier plate (in
the figure, the electrodes are marked by “+”
or “−”, symbolizing electrical connectors for
DC). Compared with the design depicted in
Figure 2.12, this design has the advantage
that it is possible to assemble many of these
sensors on one chip.
Sensing parƟcles
Electrical contacts
Carrier plate
Figure 2.13 Comparison of the sensor response between a sensor using conventional
particles and one applying nanoparticles.
0
2
4
6
8
10
12
time
0
0.25
0.5
0.75
1
sensor
response
[a.u.]
Sensing material
Conventional particles
Nanoparticles
Start
End of the test
Figure 2.13 displays schematically a comparison of the response of a sensor
made of conventional material with grains in the micrometer size range and a
sensor using nanomaterials.
Analyzing Figure 2.13, one realizes that the response of the sensor using nanoparticles is faster and the signal is better. Having the diffusion scaling law in mind,
Eq. (2.4), one expects an even faster response. In a sensor using nanoparticles, as
depicted in Figure 2.13, the time constant depends primarily on the diffusion of
the gas molecules in the open-pore network and through the conducting cover
layer.
Figure 2.14 displays a further design for gas sensors using particulate oxides
as the detector; Figure 2.15 displays the topview of such a sensor. This design
avoids the response-delaying conductive surface layer, however, the electric path
through the sensing particles is significantly longer. With respect to fabrication,
this type of sensor is more economical, as the carrier plate with electrical leads
Figure 2.14 Alternative design of a gas
sensor using nanoparticles. In this design,
the electrodes are fixed on a carrier plate (in
the figure, the electrodes are marked by “+”
or “−”, symbolizing electrical connectors for
DC). Compared with the design depicted in
Figure 2.12, this design has the advantage
that it is possible to assemble many of these
sensors on one chip.
Sensing parƟcles
Electrical contacts
Carrier plate