

296 12 Characterization of Nanomaterials
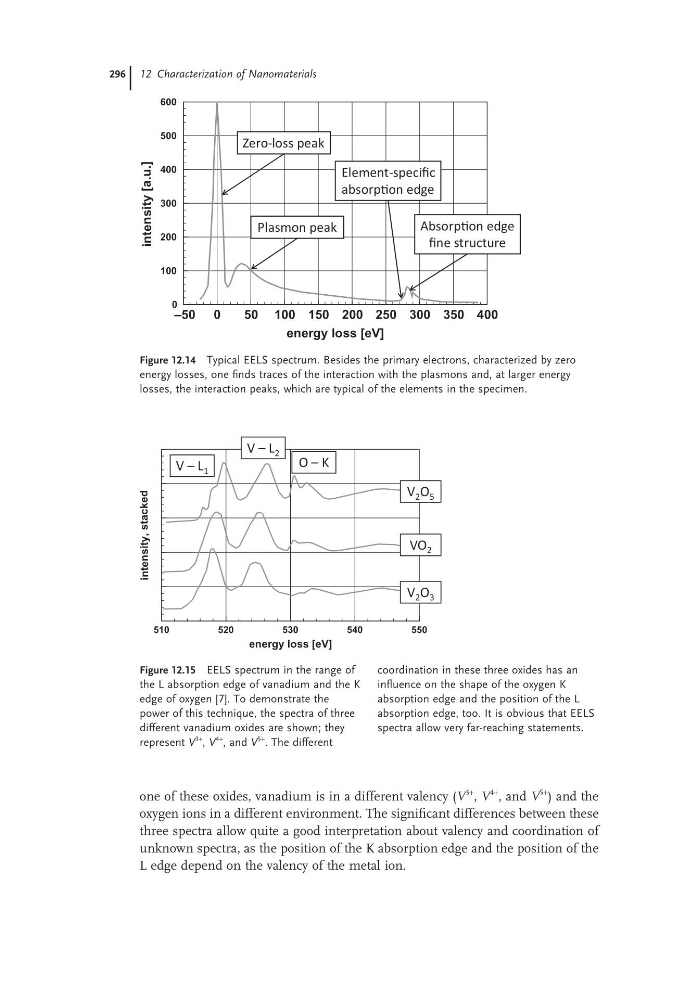
Figure 12.14 Typical EELS spectrum. Besides the primary electrons, characterized by zero
energy losses, one finds traces of the interaction with the plasmons and, at larger energy
losses, the interaction peaks, which are typical of the elements in the specimen.
–50 0
50 100 150 200 250 300 350 400
energy loss [eV]
0
100
200
300
400
500
600
intensity
[a.u.]
Zero- loss peak
Plasmon peak
AbsorpƟon edge
fine structure
Element- specific
absorpƟon edge
Figure 12.15 EELS spectrum in the range of
the L absorption edge of vanadium and the K
edge of oxygen [7]. To demonstrate the
power of this technique, the spectra of three
different vanadium oxides are shown; they
represent V
3+ , V
4+ , and V
5+
. The different
coordination in these three oxides has an
influence on the shape of the oxygen K
absorption edge and the position of the L
absorption edge, too. It is obvious that EELS
spectra allow very far-reaching statements.
510
520
530
540
550
energy loss [eV]
0
0.2
0.4
0.6
0.8
1
intensity,
stacked
V 2 O 5
V 2 O 3
VO 2
V – L 1
V – L 2 O – K
one of these oxides, vanadium is in a different valency (V
3+
, V
4+
, and V
5+
) and the
oxygen ions in a different environment. The significant differences between these
three spectra allow quite a good interpretation about valency and coordination of
unknown spectra, as the position of the K absorption edge and the position of the
L edge depend on the valency of the metal ion.
Figure 12.14 Typical EELS spectrum. Besides the primary electrons, characterized by zero
energy losses, one finds traces of the interaction with the plasmons and, at larger energy
losses, the interaction peaks, which are typical of the elements in the specimen.
–50 0
50 100 150 200 250 300 350 400
energy loss [eV]
0
100
200
300
400
500
600
intensity
[a.u.]
Zero- loss peak
Plasmon peak
AbsorpƟon edge
fine structure
Element- specific
absorpƟon edge
Figure 12.15 EELS spectrum in the range of
the L absorption edge of vanadium and the K
edge of oxygen [7]. To demonstrate the
power of this technique, the spectra of three
different vanadium oxides are shown; they
represent V
3+ , V
4+ , and V
5+
. The different
coordination in these three oxides has an
influence on the shape of the oxygen K
absorption edge and the position of the L
absorption edge, too. It is obvious that EELS
spectra allow very far-reaching statements.
510
520
530
540
550
energy loss [eV]
0
0.2
0.4
0.6
0.8
1
intensity,
stacked
V 2 O 5
V 2 O 3
VO 2
V – L 1
V – L 2 O – K
one of these oxides, vanadium is in a different valency (V
3+
, V
4+
, and V
5+
) and the
oxygen ions in a different environment. The significant differences between these
three spectra allow quite a good interpretation about valency and coordination of
unknown spectra, as the position of the K absorption edge and the position of the
L edge depend on the valency of the metal ion.