

12.3 Electron Microscopy 295
valency state of the atoms. However, this is a quantity of minor influence. Technically, an evaluation of this phenomenon is possible only in an energy range of the
emitted X-rays of less that 1 keV.
The emitted X-rays are analyzed either in a wavelength- or an energy-dispersive
system. Even though the resolution of wavelength-dispersive systems is better, the
application of energy-dispersive systems is more or less standard in connection
with electron microscopes, as these systems are faster and easier to operate.
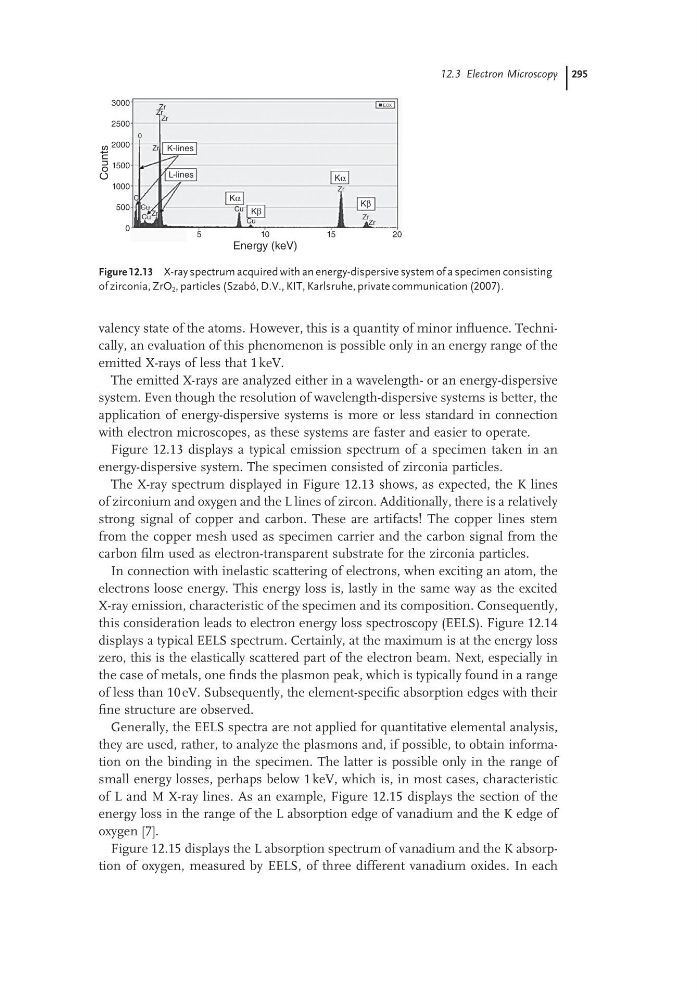
Figure 12.13 displays a typical emission spectrum of a specimen taken in an
energy-dispersive system. The specimen consisted of zirconia particles.
The X-ray spectrum displayed in Figure 12.13 shows, as expected, the K lines
of zirconium and oxygen and the L lines of zircon. Additionally, there is a relatively
strong signal of copper and carbon. These are artifacts! The copper lines stem
from the copper mesh used as specimen carrier and the carbon signal from the
carbon film used as electron-transparent substrate for the zirconia particles.
In connection with inelastic scattering of electrons, when exciting an atom, the
electrons loose energy. This energy loss is, lastly in the same way as the excited
X-ray emission, characteristic of the specimen and its composition. Consequently,
this consideration leads to electron energy loss spectroscopy (EELS). Figure 12.14
displays a typical EELS spectrum. Certainly, at the maximum is at the energy loss
zero, this is the elastically scattered part of the electron beam. Next, especially in
the case of metals, one finds the plasmon peak, which is typically found in a range
of less than 10 eV. Subsequently, the element-specific absorption edges with their
fine structure are observed.
Generally, the EELS spectra are not applied for quantitative elemental analysis,
they are used, rather, to analyze the plasmons and, if possible, to obtain information on the binding in the specimen. The latter is possible only in the range of
small energy losses, perhaps below 1 keV, which is, in most cases, characteristic
of L and M X-ray lines. As an example, Figure 12.15 displays the section of the
energy loss in the range of the L absorption edge of vanadium and the K edge of
oxygen [7].
Figure 12.15 displays the L absorption spectrum of vanadium and the K absorption of oxygen, measured by EELS, of three different vanadium oxides. In each
Figure 12.13 X-ray spectrum acquired with an energy-dispersive system of a specimen consisting
of zirconia, ZrO 2 , particles (Szabó, D.V., KIT, Karlsruhe, private communication (2007).
Counts
3000
2500
2000
1500
1000
500
0
5
10
15
20
Energy (keV)
K-lines
L-lines
Kα
Kβ
Kα
Kβ
EOX
Zr
Zr
Zr
Zr
Zr
Zr
Zr
Zr
0
C
Cu
Cu
Cu
Cu
valency state of the atoms. However, this is a quantity of minor influence. Technically, an evaluation of this phenomenon is possible only in an energy range of the
emitted X-rays of less that 1 keV.
The emitted X-rays are analyzed either in a wavelength- or an energy-dispersive
system. Even though the resolution of wavelength-dispersive systems is better, the
application of energy-dispersive systems is more or less standard in connection
with electron microscopes, as these systems are faster and easier to operate.
Figure 12.13 displays a typical emission spectrum of a specimen taken in an
energy-dispersive system. The specimen consisted of zirconia particles.
The X-ray spectrum displayed in Figure 12.13 shows, as expected, the K lines
of zirconium and oxygen and the L lines of zircon. Additionally, there is a relatively
strong signal of copper and carbon. These are artifacts! The copper lines stem
from the copper mesh used as specimen carrier and the carbon signal from the
carbon film used as electron-transparent substrate for the zirconia particles.
In connection with inelastic scattering of electrons, when exciting an atom, the
electrons loose energy. This energy loss is, lastly in the same way as the excited
X-ray emission, characteristic of the specimen and its composition. Consequently,
this consideration leads to electron energy loss spectroscopy (EELS). Figure 12.14
displays a typical EELS spectrum. Certainly, at the maximum is at the energy loss
zero, this is the elastically scattered part of the electron beam. Next, especially in
the case of metals, one finds the plasmon peak, which is typically found in a range
of less than 10 eV. Subsequently, the element-specific absorption edges with their
fine structure are observed.
Generally, the EELS spectra are not applied for quantitative elemental analysis,
they are used, rather, to analyze the plasmons and, if possible, to obtain information on the binding in the specimen. The latter is possible only in the range of
small energy losses, perhaps below 1 keV, which is, in most cases, characteristic
of L and M X-ray lines. As an example, Figure 12.15 displays the section of the
energy loss in the range of the L absorption edge of vanadium and the K edge of
oxygen [7].
Figure 12.15 displays the L absorption spectrum of vanadium and the K absorption of oxygen, measured by EELS, of three different vanadium oxides. In each
Figure 12.13 X-ray spectrum acquired with an energy-dispersive system of a specimen consisting
of zirconia, ZrO 2 , particles (Szabó, D.V., KIT, Karlsruhe, private communication (2007).
Counts
3000
2500
2000
1500
1000
500
0
5
10
15
20
Energy (keV)
K-lines
L-lines
Kα
Kβ
Kα
Kβ
EOX
Zr
Zr
Zr
Zr
Zr
Zr
Zr
Zr
0
C
Cu
Cu
Cu
Cu