

10.4 Electrical Conductivity of Nanocomposites 247
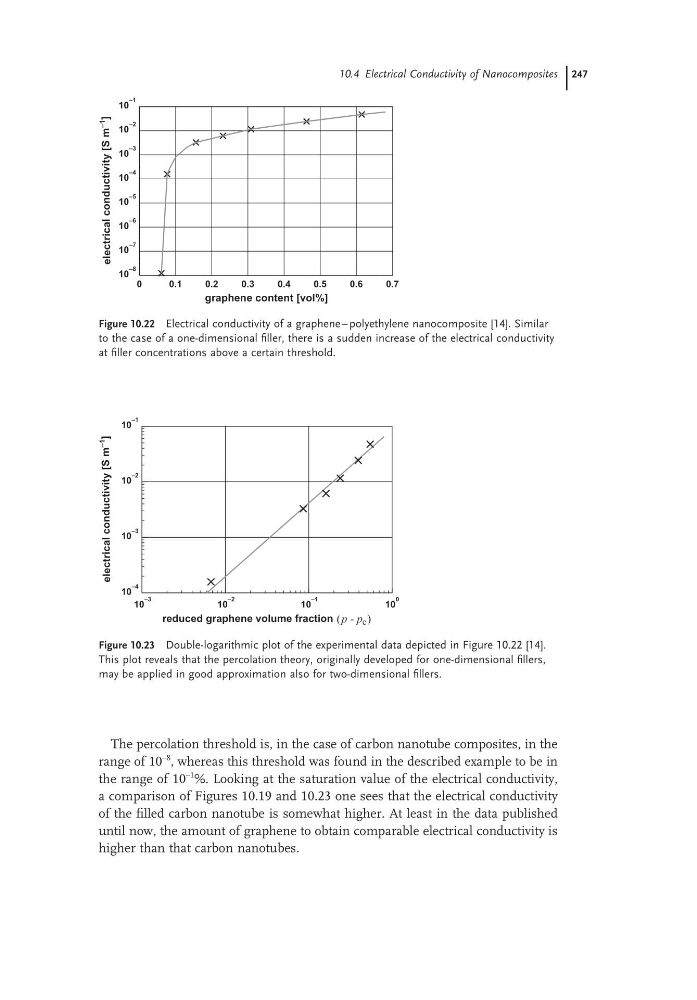
The percolation threshold is, in the case of carbon nanotube composites, in the
range of 10
−8
, whereas this threshold was found in the described example to be in
the range of 10
−1 %. Looking at the saturation value of the electrical conductivity,
a comparison of Figures 10.19 and 10.23 one sees that the electrical conductivity
of the filled carbon nanotube is somewhat higher. At least in the data published
until now, the amount of graphene to obtain comparable electrical conductivity is
higher than that carbon nanotubes.
Figure 10.22 Electrical conductivity of a graphene – polyethylene nanocomposite [14]. Similar
to the case of a one-dimensional filler, there is a sudden increase of the electrical conductivity
at filler concentrations above a certain threshold.
0
0.1
0.2
0.3
0.4
0.5
0.6
0.7
graphene content [vol%]
10
–8
10
–7
10
–6
10
–5
10
–4
10
–3
10
–2
10
–1
electrical
conductivity
[S
m
–1
]
Figure 10.23 Double-logarithmic plot of the experimental data depicted in Figure 10.22 [14].
This plot reveals that the percolation theory, originally developed for one-dimensional fillers,
may be applied in good approximation also for two-dimensional fillers.
10
–3
10
–2
10
–1
10
0
reduced graphene volume fraction (p - p c )
10
–4
10
–3
10
–2
10
–1
electrical
conductivity
[S
m
–1
]
The percolation threshold is, in the case of carbon nanotube composites, in the
range of 10
−8
, whereas this threshold was found in the described example to be in
the range of 10
−1 %. Looking at the saturation value of the electrical conductivity,
a comparison of Figures 10.19 and 10.23 one sees that the electrical conductivity
of the filled carbon nanotube is somewhat higher. At least in the data published
until now, the amount of graphene to obtain comparable electrical conductivity is
higher than that carbon nanotubes.
Figure 10.22 Electrical conductivity of a graphene – polyethylene nanocomposite [14]. Similar
to the case of a one-dimensional filler, there is a sudden increase of the electrical conductivity
at filler concentrations above a certain threshold.
0
0.1
0.2
0.3
0.4
0.5
0.6
0.7
graphene content [vol%]
10
–8
10
–7
10
–6
10
–5
10
–4
10
–3
10
–2
10
–1
electrical
conductivity
[S
m
–1
]
Figure 10.23 Double-logarithmic plot of the experimental data depicted in Figure 10.22 [14].
This plot reveals that the percolation theory, originally developed for one-dimensional fillers,
may be applied in good approximation also for two-dimensional fillers.
10
–3
10
–2
10
–1
10
0
reduced graphene volume fraction (p - p c )
10
–4
10
–3
10
–2
10
–1
electrical
conductivity
[S
m
–1
]