

242 10 Electrical Properties
left-hand side, a nonpercolating system, that means a system without a closed path
for electrical conductivity and on the right-hand side, a percolating composite,
showing electrical conductivity, are plotted.
It can be understood easily that to obtain percolation by forming a percolation
path, a minimum amount of filler is necessary. The general dependency of the
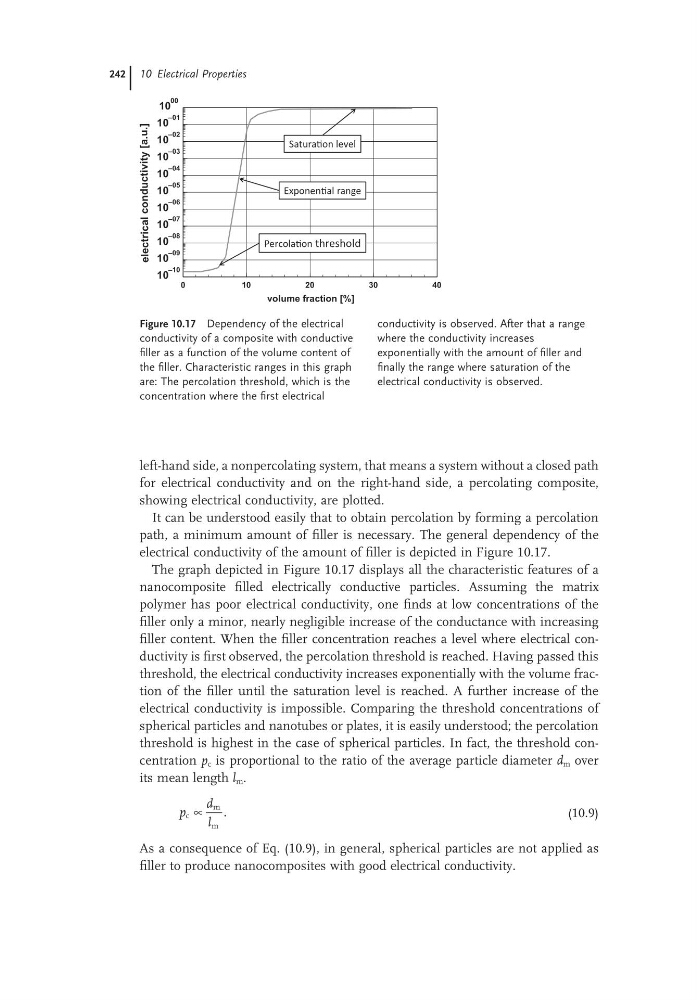
electrical conductivity of the amount of filler is depicted in Figure 10.17.
The graph depicted in Figure 10.17 displays all the characteristic features of a
nanocomposite filled electrically conductive particles. Assuming the matrix
polymer has poor electrical conductivity, one finds at low concentrations of the
filler only a minor, nearly negligible increase of the conductance with increasing
filler content. When the filler concentration reaches a level where electrical conductivity is first observed, the percolation threshold is reached. Having passed this
threshold, the electrical conductivity increases exponentially with the volume fraction of the filler until the saturation level is reached. A further increase of the
electrical conductivity is impossible. Comparing the threshold concentrations of
spherical particles and nanotubes or plates, it is easily understood; the percolation
threshold is highest in the case of spherical particles. In fact, the threshold concentration p c is proportional to the ratio of the average particle diameter d m over
its mean length l m .
p
d
l
c
m
m
∝
.
(10.9)
As a consequence of Eq. (10.9), in general, spherical particles are not applied as
filler to produce nanocomposites with good electrical conductivity.
Figure 10.17 Dependency of the electrical
conductivity of a composite with conductive
filler as a function of the volume content of
the filler. Characteristic ranges in this graph
are: The percolation threshold, which is the
concentration where the first electrical
conductivity is observed. After that a range
where the conductivity increases
exponentially with the amount of filler and
finally the range where saturation of the
electrical conductivity is observed.
0
10
20
30
40
volume fraction [%]
10
–10
10
–09
10
–08
10
–07
10
–06
10
–05
10
–04
10
–03
10
–02
10
–01
10
00
electrical
conductivity
[a.u.]
PercolaƟon threshold
ExponenƟal range
SaturaƟon level
left-hand side, a nonpercolating system, that means a system without a closed path
for electrical conductivity and on the right-hand side, a percolating composite,
showing electrical conductivity, are plotted.
It can be understood easily that to obtain percolation by forming a percolation
path, a minimum amount of filler is necessary. The general dependency of the
electrical conductivity of the amount of filler is depicted in Figure 10.17.
The graph depicted in Figure 10.17 displays all the characteristic features of a
nanocomposite filled electrically conductive particles. Assuming the matrix
polymer has poor electrical conductivity, one finds at low concentrations of the
filler only a minor, nearly negligible increase of the conductance with increasing
filler content. When the filler concentration reaches a level where electrical conductivity is first observed, the percolation threshold is reached. Having passed this
threshold, the electrical conductivity increases exponentially with the volume fraction of the filler until the saturation level is reached. A further increase of the
electrical conductivity is impossible. Comparing the threshold concentrations of
spherical particles and nanotubes or plates, it is easily understood; the percolation
threshold is highest in the case of spherical particles. In fact, the threshold concentration p c is proportional to the ratio of the average particle diameter d m over
its mean length l m .
p
d
l
c
m
m
∝
.
(10.9)
As a consequence of Eq. (10.9), in general, spherical particles are not applied as
filler to produce nanocomposites with good electrical conductivity.
Figure 10.17 Dependency of the electrical
conductivity of a composite with conductive
filler as a function of the volume content of
the filler. Characteristic ranges in this graph
are: The percolation threshold, which is the
concentration where the first electrical
conductivity is observed. After that a range
where the conductivity increases
exponentially with the amount of filler and
finally the range where saturation of the
electrical conductivity is observed.
0
10
20
30
40
volume fraction [%]
10
–10
10
–09
10
–08
10
–07
10
–06
10
–05
10
–04
10
–03
10
–02
10
–01
10
00
electrical
conductivity
[a.u.]
PercolaƟon threshold
ExponenƟal range
SaturaƟon level