

7.4 Heat Capacity of Nanoparticles 143
freedom for vibration, these impurities contribute overproportional to the heat
capacity. This was experimentally proven using the example of platinum [10].
The same arguments and phenomena as described for metals are valid for
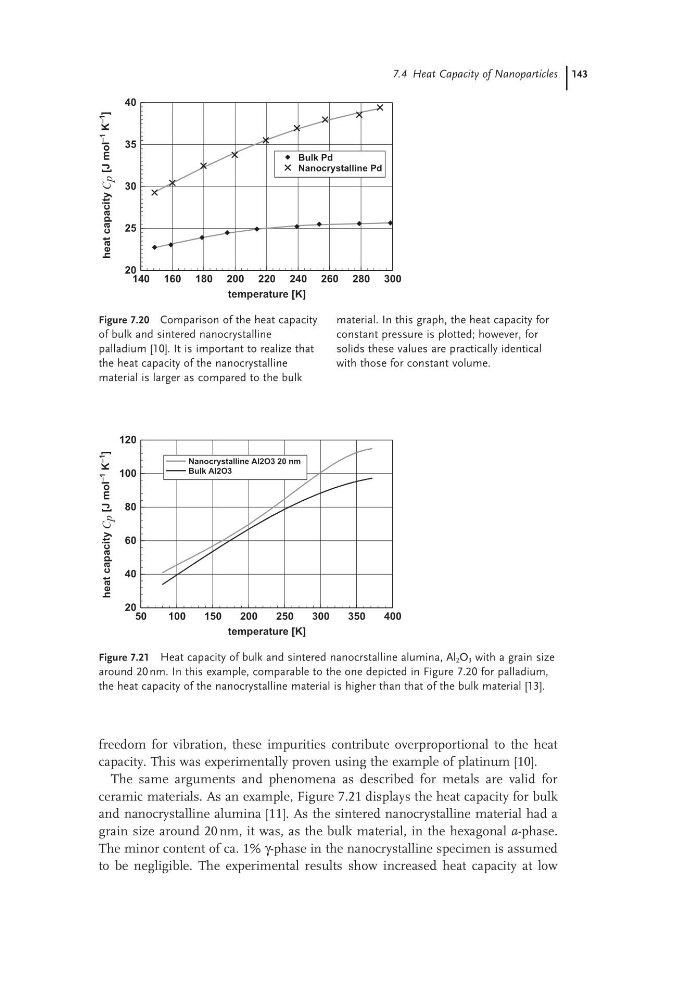
ceramic materials. As an example, Figure 7.21 displays the heat capacity for bulk
and nanocrystalline alumina [11]. As the sintered nanocrystalline material had a
grain size around 20 nm, it was, as the bulk material, in the hexagonal a-phase.
The minor content of ca. 1% γ-phase in the nanocrystalline specimen is assumed
to be negligible. The experimental results show increased heat capacity at low
Figure 7.20 Comparison of the heat capacity
of bulk and sintered nanocrystalline
palladium [10]. It is important to realize that
the heat capacity of the nanocrystalline
material is larger as compared to the bulk
material. In this graph, the heat capacity for
constant pressure is plotted; however, for
solids these values are practically identical
with those for constant volume.
140 160 180 200 220 240 260 280 300
temperature [K]
20
25
30
35
40
heat
capacity C p
[J
mol
–1
K
–1
]
Bulk Pd
Nanocrystalline Pd
Figure 7.21 Heat capacity of bulk and sintered nanocrstalline alumina, Al 2 O 3 with a grain size
around 20 nm. In this example, comparable to the one depicted in Figure 7.20 for palladium,
the heat capacity of the nanocrystalline material is higher than that of the bulk material [13].
50
100
150
200
250
300
350
400
temperature [K]
20
40
60
80
100
120
heat
capacity C p
[J
mol
–1
K
–1
]
Nanocrystalline Al2O3 20 nm
Bulk Al2O3
freedom for vibration, these impurities contribute overproportional to the heat
capacity. This was experimentally proven using the example of platinum [10].
The same arguments and phenomena as described for metals are valid for
ceramic materials. As an example, Figure 7.21 displays the heat capacity for bulk
and nanocrystalline alumina [11]. As the sintered nanocrystalline material had a
grain size around 20 nm, it was, as the bulk material, in the hexagonal a-phase.
The minor content of ca. 1% γ-phase in the nanocrystalline specimen is assumed
to be negligible. The experimental results show increased heat capacity at low
Figure 7.20 Comparison of the heat capacity
of bulk and sintered nanocrystalline
palladium [10]. It is important to realize that
the heat capacity of the nanocrystalline
material is larger as compared to the bulk
material. In this graph, the heat capacity for
constant pressure is plotted; however, for
solids these values are practically identical
with those for constant volume.
140 160 180 200 220 240 260 280 300
temperature [K]
20
25
30
35
40
heat
capacity C p
[J
mol
–1
K
–1
]
Bulk Pd
Nanocrystalline Pd
Figure 7.21 Heat capacity of bulk and sintered nanocrstalline alumina, Al 2 O 3 with a grain size
around 20 nm. In this example, comparable to the one depicted in Figure 7.20 for palladium,
the heat capacity of the nanocrystalline material is higher than that of the bulk material [13].
50
100
150
200
250
300
350
400
temperature [K]
20
40
60
80
100
120
heat
capacity C p
[J
mol
–1
K
–1
]
Nanocrystalline Al2O3 20 nm
Bulk Al2O3