

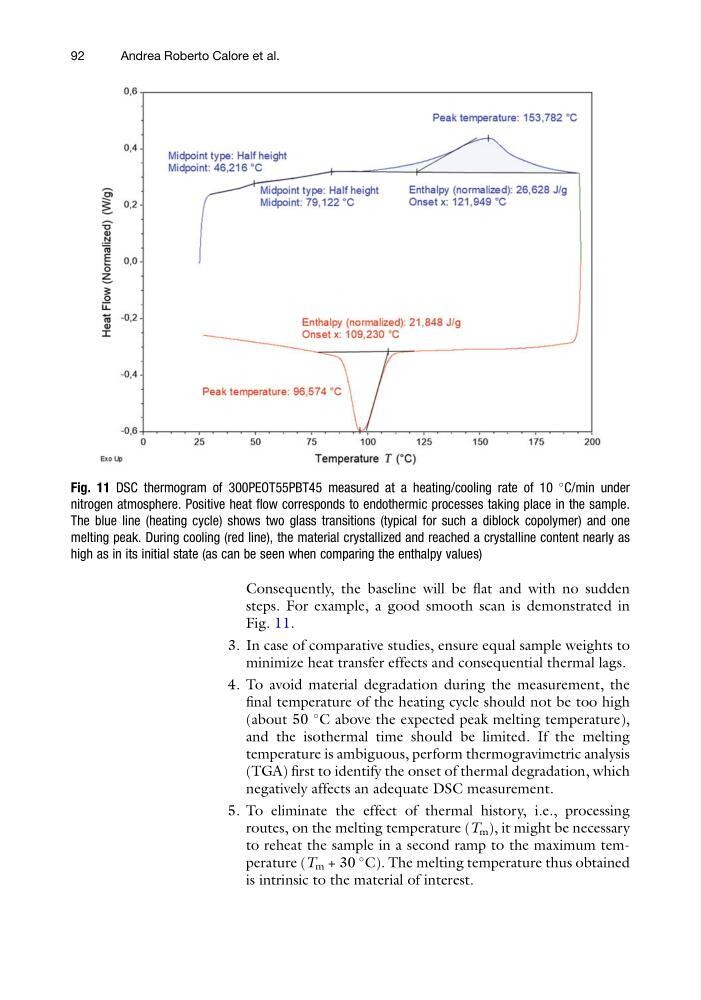
Consequently, the baseline will be flat and with no sudden
steps. For example, a good smooth scan is demonstrated in
Fig. 11.
3. In case of comparative studies, ensure equal sample weights to
minimize heat transfer effects and consequential thermal lags.
4. To avoid material degradation during the measurement, the
final temperature of the heating cycle should not be too high
(about 50
C above the expected peak melting temperature),
and the isothermal time should be limited. If the melting
temperature is ambiguous, perform thermogravimetric analysis
(TGA) first to identify the onset of thermal degradation, which
negatively affects an adequate DSC measurement.
5. To eliminate the effect of thermal history, i.e., processing
routes, on the melting temperature (T m ), it might be necessary
to reheat the sample in a second ramp to the maximum temperature (T m + 30
C). The melting temperature thus obtained
is intrinsic to the material of interest.
Fig. 11 DSC thermogram of 300PEOT55PBT45 measured at a heating/cooling rate of 10
C/min under
nitrogen atmosphere. Positive heat flow corresponds to endothermic processes taking place in the sample.
The blue line (heating cycle) shows two glass transitions (typical for such a diblock copolymer) and one
melting peak. During cooling (red line), the material crystallized and reached a crystalline content nearly as
high as in its initial state (as can be seen when comparing the enthalpy values)
92
Andrea Roberto Calore et al.
steps. For example, a good smooth scan is demonstrated in
Fig. 11.
3. In case of comparative studies, ensure equal sample weights to
minimize heat transfer effects and consequential thermal lags.
4. To avoid material degradation during the measurement, the
final temperature of the heating cycle should not be too high
(about 50
C above the expected peak melting temperature),
and the isothermal time should be limited. If the melting
temperature is ambiguous, perform thermogravimetric analysis
(TGA) first to identify the onset of thermal degradation, which
negatively affects an adequate DSC measurement.
5. To eliminate the effect of thermal history, i.e., processing
routes, on the melting temperature (T m ), it might be necessary
to reheat the sample in a second ramp to the maximum temperature (T m + 30
C). The melting temperature thus obtained
is intrinsic to the material of interest.
Fig. 11 DSC thermogram of 300PEOT55PBT45 measured at a heating/cooling rate of 10
C/min under
nitrogen atmosphere. Positive heat flow corresponds to endothermic processes taking place in the sample.
The blue line (heating cycle) shows two glass transitions (typical for such a diblock copolymer) and one
melting peak. During cooling (red line), the material crystallized and reached a crystalline content nearly as
high as in its initial state (as can be seen when comparing the enthalpy values)
92
Andrea Roberto Calore et al.